Quarto Dashboards
Lecture 20
Duke University
STA 313 - Spring 2024
Warm up
What is visualization about?

“My eyes hurt”
Announcements
HW 5 due today at 5 pm
RQ 6 (last quiz) to be posted by the weekend, covers up to and including tables, due at 10 am on Tue, April 15
Work on projects tomorrow in lab
Last week
Building interactive apps with Shiny
Building interactive dashboards with Shiny and bslib
Review
Code for Shiny app: https://github.com/vizdata-s24/vizdata-s24/blob/main/slides/18/manager-survey/app.R
Code for Shiny+bslib dashboard: https://github.com/vizdata-s24/vizdata-s24/blob/main/slides/19/manager-survey-bslib/app.R
Any questions about any of the components from last week?
Quarto dashboards
A new output format for easily creating
dashboards from .qmd files
.qmd ➝ Dashboard
Dashboard Components
Navigation Bar and Pages — Icon, title, and author along with links to sub-pages (if more than one page is defined).
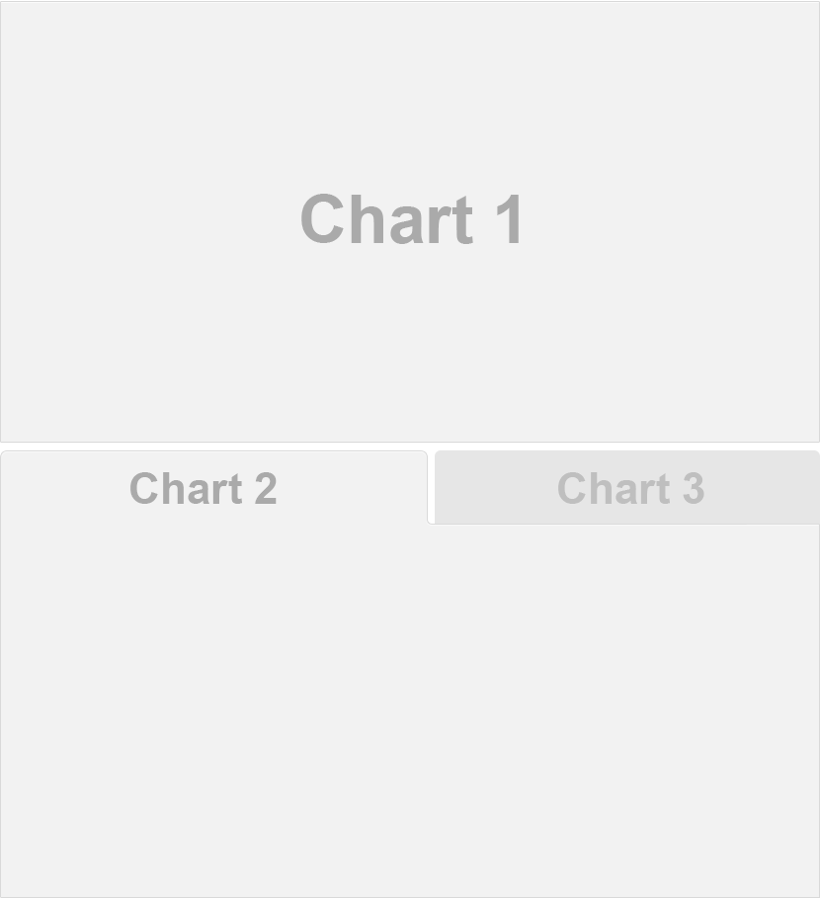
Sidebars, Rows & Columns, and Tabsets — Rows and columns using markdown heading (with optional attributes to control height, width, etc.). Sidebars for interactive inputs. Tabsets to further divide content.
Cards (Plots, Tables, Value Boxes, Content) — Cards are containers for cell outputs and free form markdown text. The content of cards typically maps to cells in your notebook or source document.
Navigation Bar and Pages

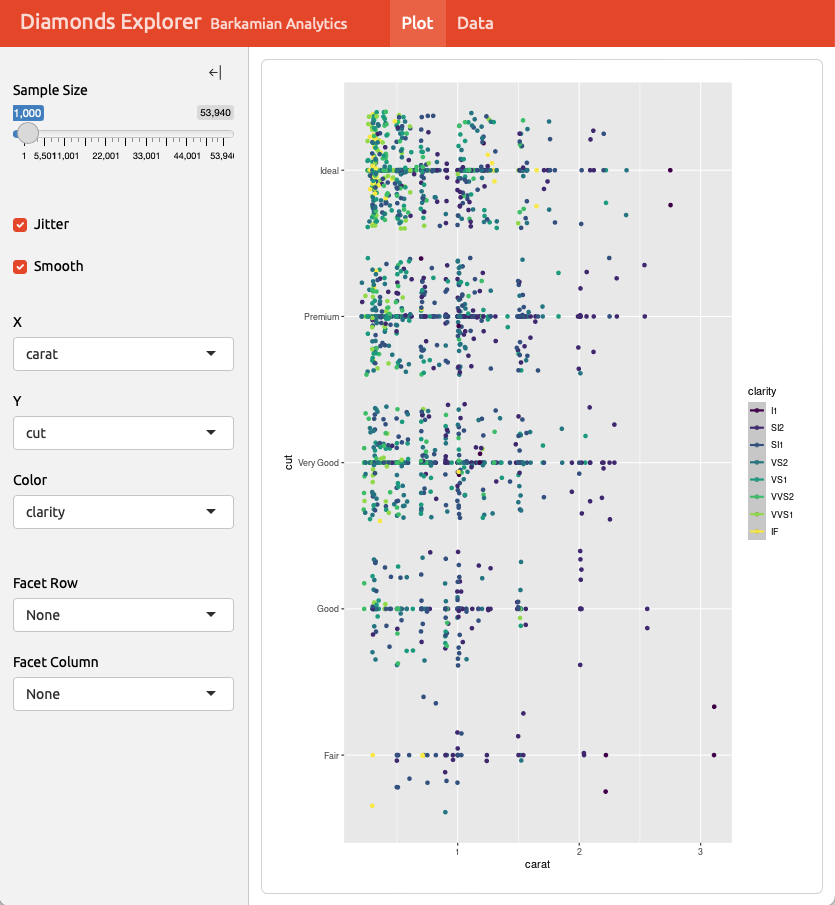
Sidebars: Page Level
Sidebars: Global
Layout: Rows
Layout: Columns
Tabset
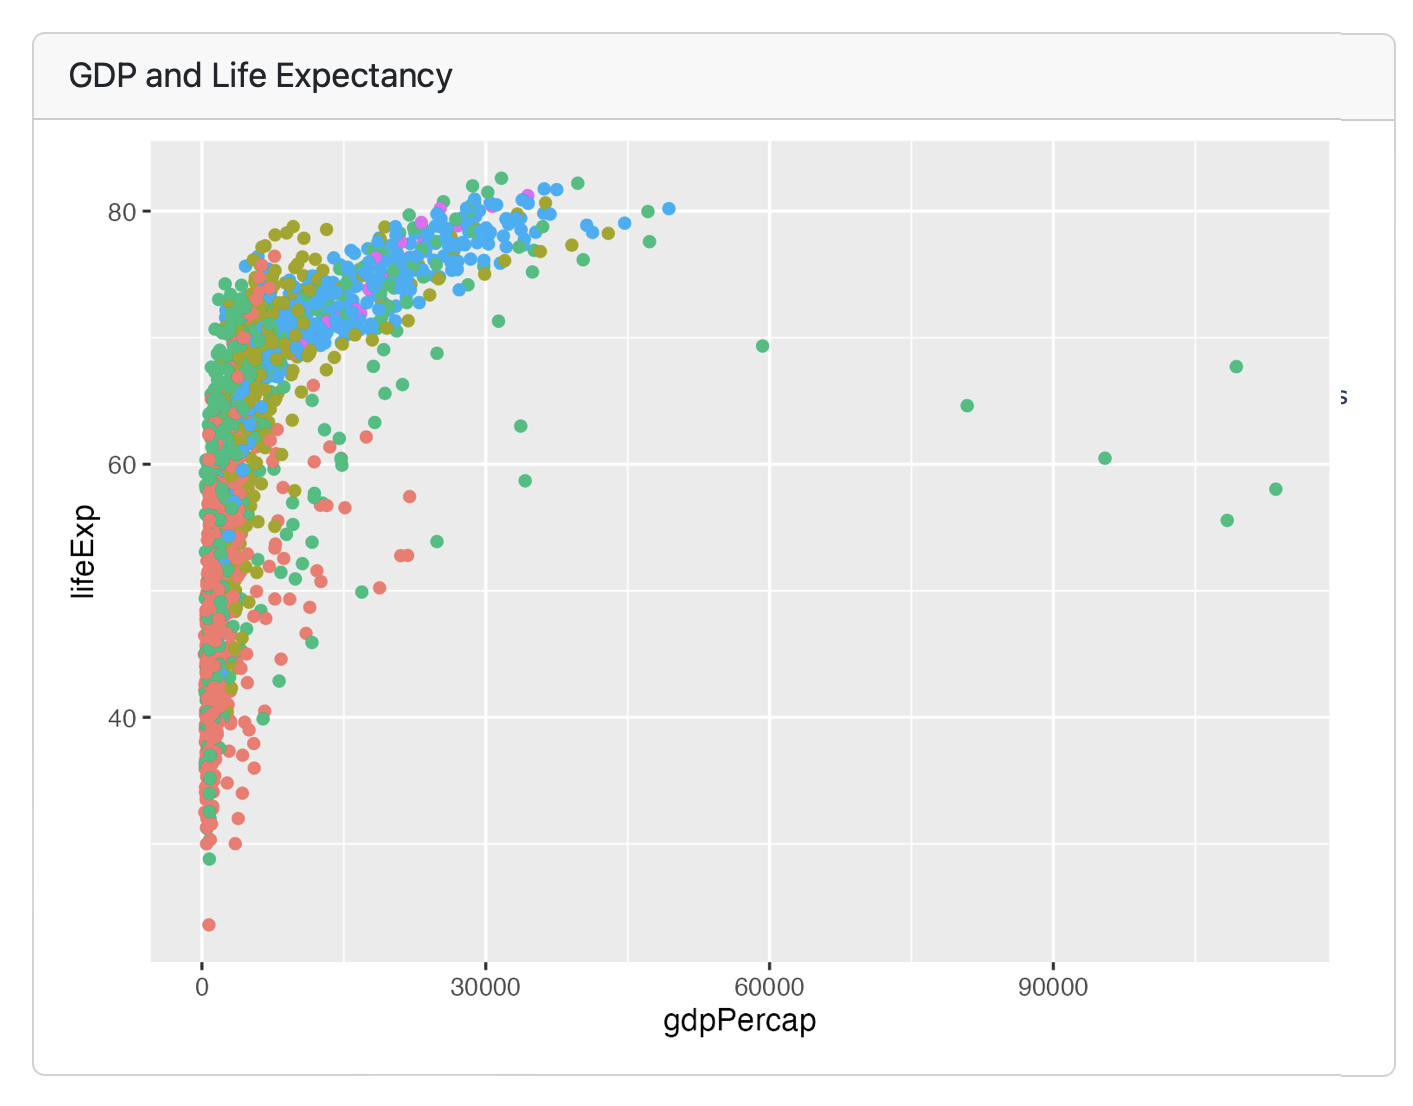
Plots
Each code chunk makes a card, and can take a title
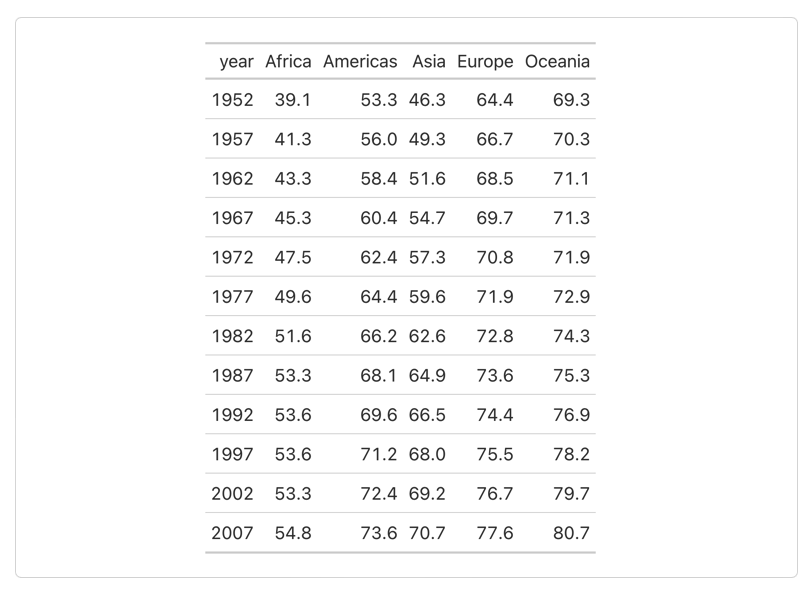
Tables
Each code chunk makes a card, doesn’t have to have a title
Other features
Text content
Value boxes
Expanding cards
Dashboard deployment
Dashboards are typically just static HTML pages so can be deployed to any web server or web host!
Interactive Dashboards
https://quarto.org/docs/dashboards/interactivity/shiny-r
For interactive exploration, some dashboards can benefit from a live R backend
To do this with Quarto Dashboards, add interactive Shiny components
Deploy with or without a server!
Let’s make a Quarto dashboard
ae-15 - Step 1
- Review dashboard layout components.
- Sidebar: Make callout collapsible.
- All tabs: Add values to valueboxes.
- Data tab: Add leaflet map and data table.
ae-15 - Step 2
Parameters: Make date a parameter.
ae-15 - Step 3
Theming: Add a light and dark theme.
Quarto dashboard, but make it Python!
https://github.com/mine-cetinkaya-rundel/dashing-through-snow
- R:
- Python:
