# load packages
library(tidyverse)
library(ggthemes)
library(scales)

# set theme for ggplot2
ggplot2::theme_set(ggplot2::theme_minimal(base_size = 14))

# set figure parameters for knitr
knitr::opts_chunk$set(
  fig.width = 7, # 7" width
  fig.asp = 0.618, # the golden ratio
  fig.retina = 3, # dpi multiplier for displaying HTML output on retina
  fig.align = "center", # center align figures
  dpi = 300 # higher dpi, sharper image
)Du Bois visualizations
Lecture 10
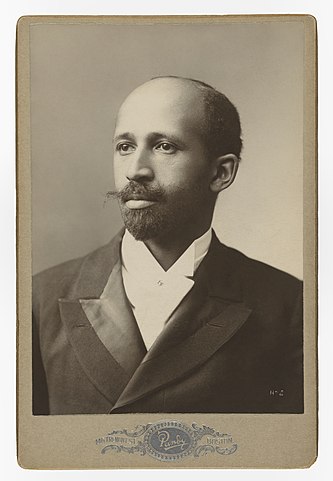
W.E.B. Du Bois
W.E.B. (William Edward Burghardt) Du Bois (February 23, 1868 – August 27, 1963) was a professor of history, sociology, and economics at Atlanta University and one of the founders of the NAACP in 1909.
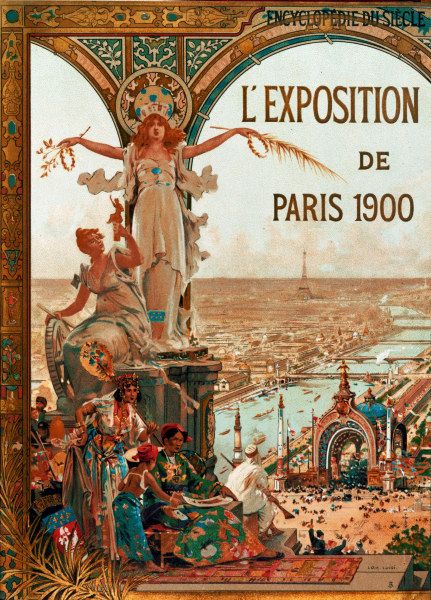
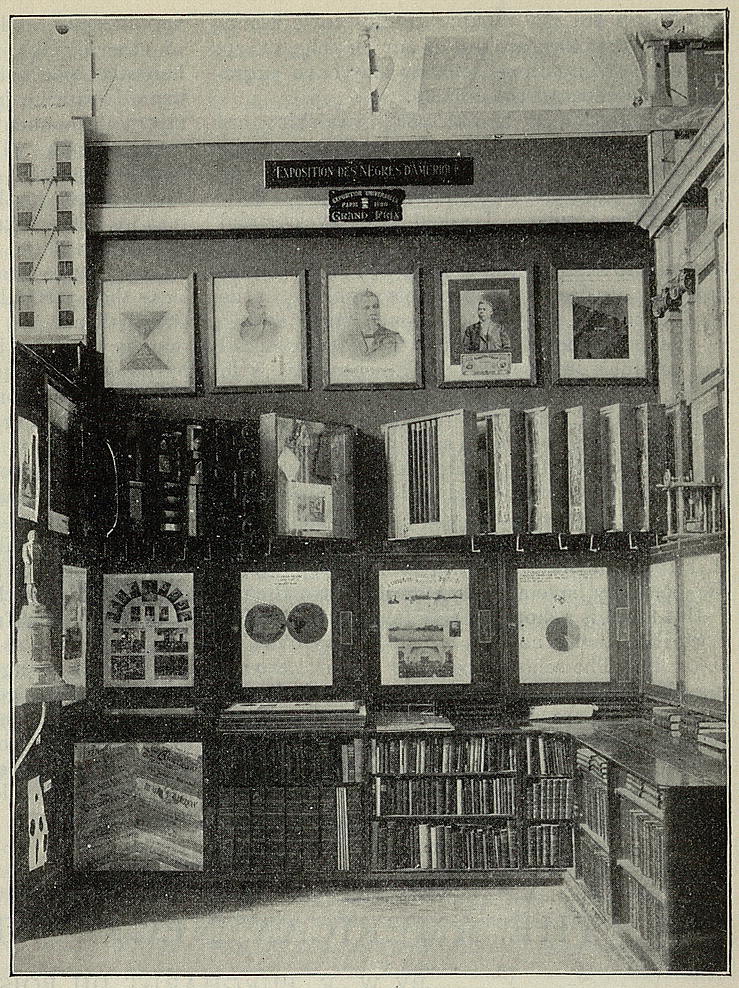
1900 Paris Exposition
The Exposition Universelle of 1900, better known in English as the 1900 Paris Exposition, was a world’s fair held in Paris, France, in November 1900, to celebrate the achievements of the past century and to accelerate development into the next.
1900 Paris Exposition
Du Bois’s visualizations were part of the Exposition des Nègres d’Amérique (The Exhibit of American Negroes), an exhibit organized by newspaper editor Thomas Junius Calloway.
The goal of the exhibit was to tell the story of African Americans after Emancipation using a variety of items including texts, portraits, and data visualizations.
The exhibit highlighted the progress made by African Americans, and Du Bois, in particular, used data and visualizations to counter the “narrative of Black inferiority” and to humanize the African American experience.
Visualizations and photographs from the 1900 Paris Exposition are available in the Library of Congress digital collection.
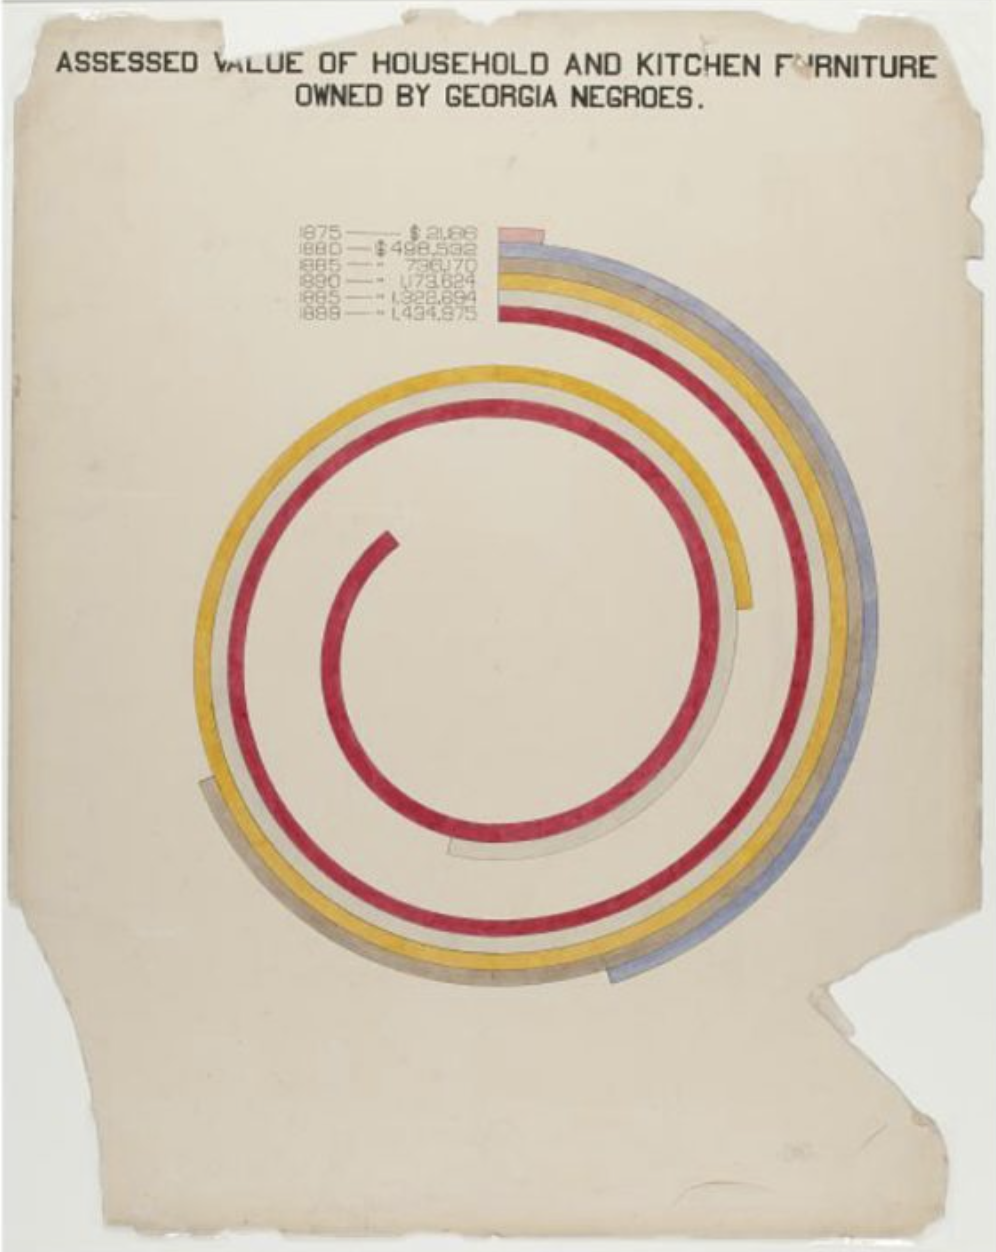
Spiral charts
One of the most distinctive Du Bois innovations.
Instead of stretching out large measures linearly, the values are “rolled up” in a spiral.
Used to show growth over time (e.g., property values, household assets).
Often highlighted as iconic examples of Du Bois’s creative approach to data visualization.
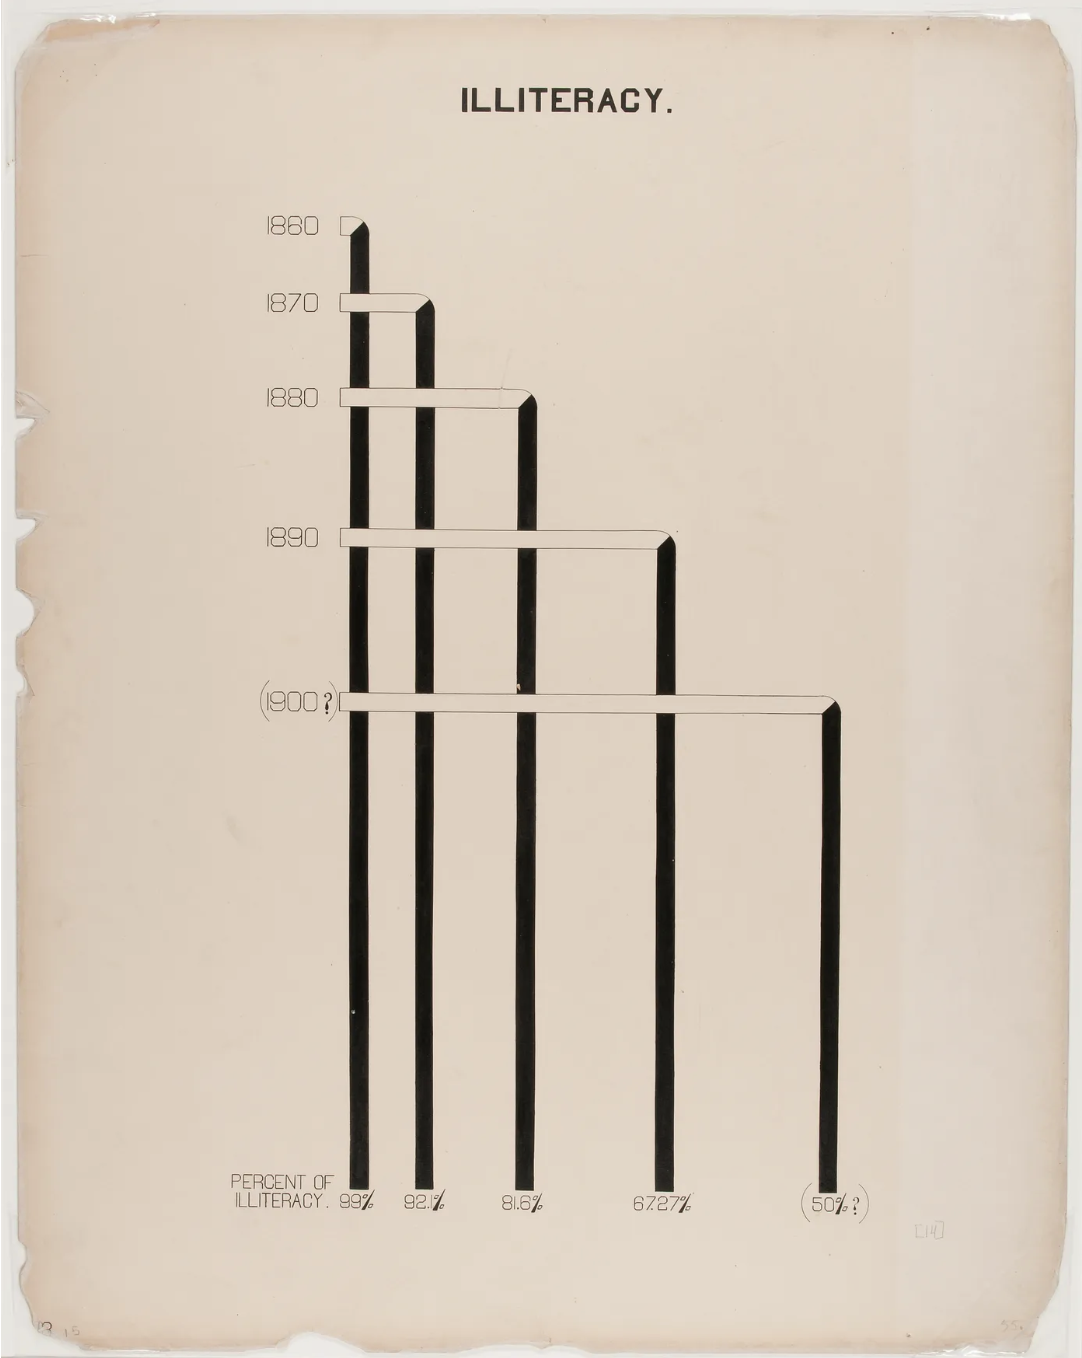
Unconventional bar variations
Du Bois innovated beyond conventional bar charts:
Wrapped bars: When values are too large, bars wrap across 2-3 lines
Woven bars: Interlocking pattern of two contrasting colors to compare two groups (e.g., two cities)
Shaped bars: Bars that echo the shape of their subject (e.g., Georgia-shaped bars for Georgia data)
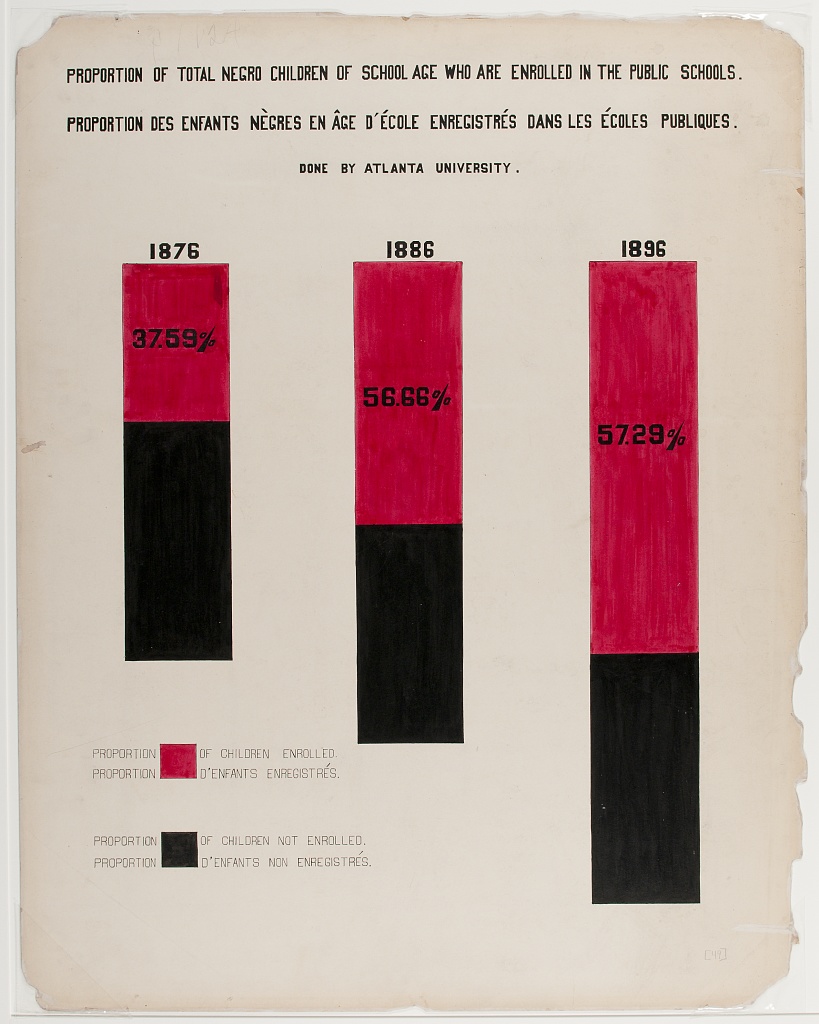
Proportion bars: 1-3 vertical bars with 2-3 solid colors showing proportions, sometimes tilted 45 degrees
Proportion of Freemen and Slaves
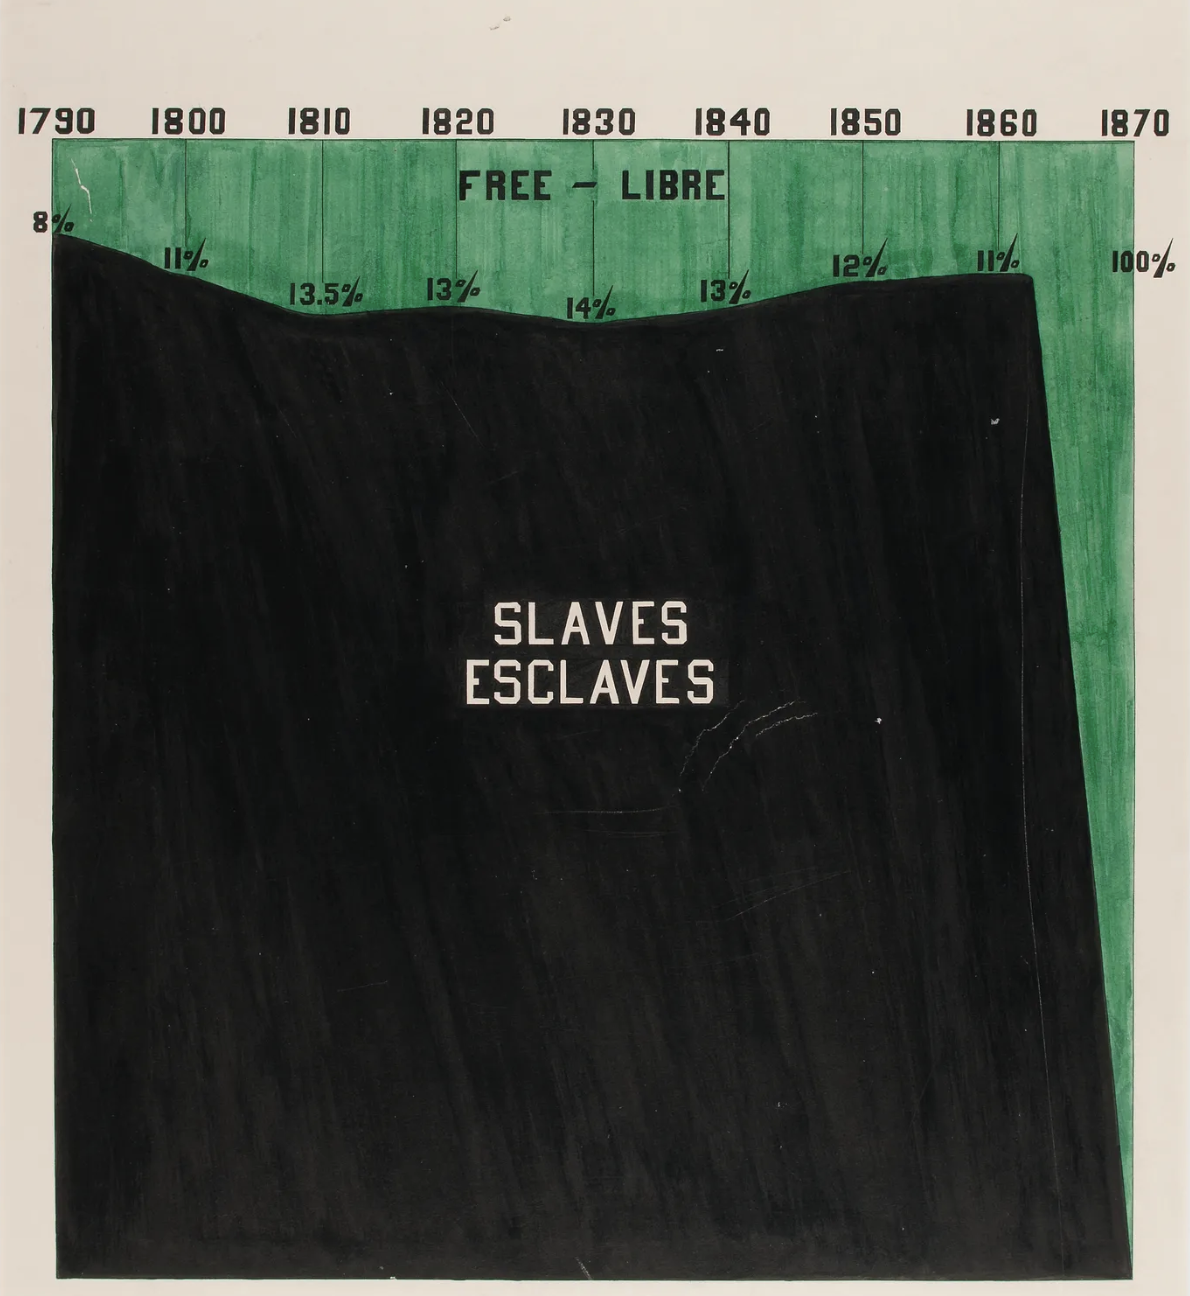
“Proportion of Freemen and Slaves among American Negroes”, 1900, via Library of Congress Prints and Photographs Division
Illiteracy
“Illiteracy” 1900, via Library of Congress Prints and Photographs Division
City and rural population
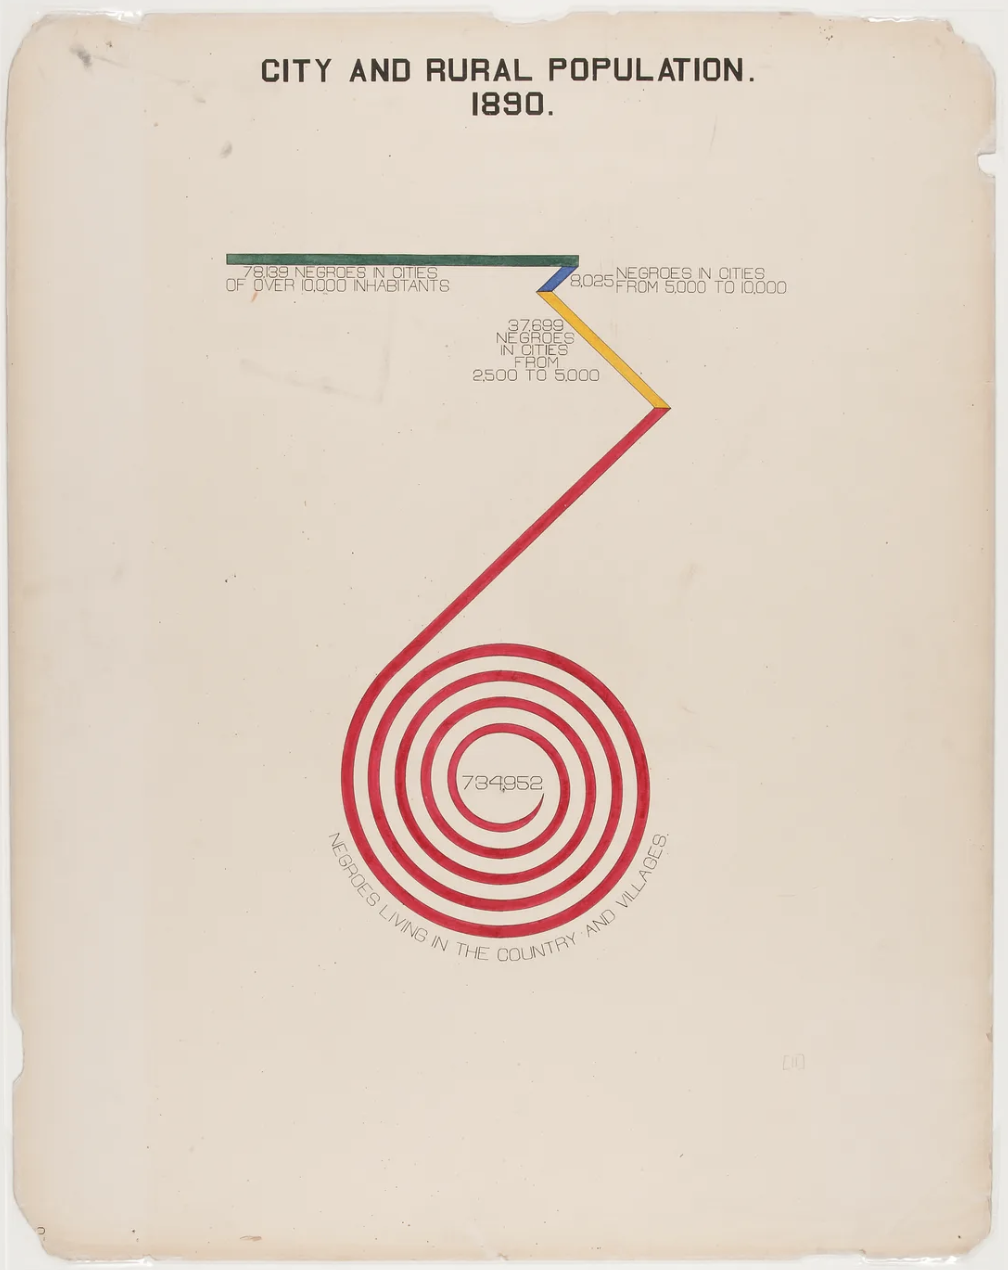
“City and Rural Population. 1890” 1900, via Library of Congress Prints and Photographs Division
Recreation activities
The most prevalent type of visualizations created by W. E. B. Du Bois are bar charts, so the activities (ae-07) will focus on recreating the following, seemingly simple, bar charts.