# load packages
library(tidyverse)
library(ggthemes)

# set theme for ggplot2
ggplot2::theme_set(ggplot2::theme_minimal(base_size = 14))

# set figure parameters for knitr
knitr::opts_chunk$set(
  fig.width = 7, # 7" width
  fig.asp = 0.618, # the golden ratio
  fig.retina = 3, # dpi multiplier for displaying HTML output on retina
  fig.align = "center", # center align figures
  dpi = 300 # higher dpi, sharper image
)Visualizing likert data II
Lecture 8
Dr. Mine Çetinkaya-Rundel
Duke University
STA 313 - Spring 2026
Warm up
Announcements
Quiz 01 grades posted on Canvas, feedback available on Gradescope
HW 1 feedback posted as GitHub issue in your HW 1 repo
HW 1 grades will be posted on Canvas this week
HW 2 due next Monday at 5 pm. Question 5 is an extra credit question:
- You review the feedback from HW 1 and close the issue(s).
- You write a brief reflection on what you’ve learned.
OH today: Alexa 3-4 pm in Old Chem 203B (usual location), Leah 4-5 pm on Zoom
Lessons from HW 1
Render your documents!
Formatting links as clickable URLs or hyperlinks:
- Font sizes in plots should be optimized for legibility in the rendered document
Setup
From last time:
2020 Durham City and County Resident Survey
Rows: 848
Columns: 49
$ id                                      <dbl> 1, 2, 3, 4, 5, 6, 7, 8, NA, 10…
$ overall_quality_of_services_3_01        <dbl> 3, 4, 4, 4, 4, 3, 5, 2, 4, 3, …
$ overall_quality_of_services_3_02        <dbl> 3, 4, 4, 4, 4, 4, 4, 4, 4, 3, …
$ overall_appearance_of_durham_3_03       <dbl> 2, 4, 4, 4, 4, 4, 4, 2, 3, 2, …
$ overall_management_of_develo_3_04       <dbl> 2, 2, 4, 4, 3, 2, 3, 2, 3, 2, …
$ overall_image_of_durham_3_05            <dbl> 2, 4, 4, 4, 2, 1, 4, 2, 3, 2, …
$ overall_quality_of_life_in_d_3_06       <dbl> 2, 4, 4, 3, 4, 4, 4, 3, 3, 2, …
$ overall_quality_of_life_in_y_3_07       <dbl> 5, 5, 4, 4, 5, 4, 3, 5, 4, 5, …
$ overall_value_you_receive_fo_3_08       <dbl> 3, 5, 4, 4, 3, 3, 4, 4, 2, 4, …
$ do_your_monthly_housing_cost_12_01      <dbl> 2, 2, 2, NA, 2, 2, 2, 2, NA, 1…
$ are_you_able_to_find_housing_12_02      <dbl> 1, NA, 1, 1, 1, 1, 1, 1, 1, 2,…
$ do_you_have_major_home_repai_12_03      <dbl> 2, 1, 2, 2, 2, 2, 2, 2, 2, 2, …
$ ease_of_travel_by_walking_18_01         <dbl> NA, 4, 2, 4, 4, 3, 2, 3, 3, 4,…
$ ease_of_travel_by_biking_18_02          <dbl> NA, 3, 2, 3, 4, 2, 3, 2, NA, 4…
$ ease_of_travel_by_bus_godu_18_03        <dbl> NA, 3, 2, 3, NA, 3, NA, NA, NA…
$ quality_of_downtown_parking_18_04       <dbl> 2, 3, 3, 3, 3, 3, 4, 3, 1, 4, …
$ the_ability_in_your_neighbo_18_05       <dbl> 4, 5, 4, 4, 4, 4, 2, 5, 5, 5, …
$ as_a_place_to_live_24_01                <dbl> 3, 5, 4, 4, 4, 4, 4, 3, 4, 3, …
$ as_a_place_to_work_24_02                <dbl> 4, 4, NA, 4, NA, 5, NA, 3, 4, …
$ as_a_place_to_play_24_03                <dbl> 3, 4, NA, 4, 3, 3, NA, 4, 4, 3…
$ as_a_place_to_raise_childre_24_04       <dbl> 2, 4, NA, NA, 2, 4, NA, 3, NA,…
$ as_a_place_to_educate_child_24_05       <dbl> 2, 4, NA, NA, 1, 4, NA, 2, NA,…
$ as_a_place_to_retire_24_06              <dbl> 2, 4, 4, 4, 4, 4, NA, 1, 4, 2,…
$ as_a_place_to_visit_24_07               <dbl> 3, 4, 3, 3, 5, 4, 4, 2, 3, 2, …
$ as_a_place_to_start_a_busin_24_08       <dbl> 3, 4, NA, 3, NA, NA, NA, 3, 3,…
$ as_a_community_that_is_movi_24_09       <dbl> 1, 5, 4, 4, 3, 3, 4, 3, 3, 2, …
$ have_you_or_someone_in_your_househol_26 <dbl> 2, 2, 2, 2, 2, 2, 2, 2, 2, 2, …
$ approximately_how_many_years_have_yo_28 <dbl> 29, 34, 15, 11, 4, 35, 3, 25, …
$ what_is_your_age_29                     <dbl> 1, 3, 2, 1, 1, 4, 1, 1, 5, 1, …
$ what_is_your_gender_30                  <dbl> 1, 2, 1, 2, 1, 1, 1, 2, 2, 2, …
$ do_you_own_or_rent_your_current_resi_31 <dbl> 1, 2, 1, 1, 1, 1, 1, 2, 1, 1, …
$ asianpacific_islander_32_01             <dbl> NA, NA, NA, NA, NA, NA, NA, NA…
$ white_32_02                             <dbl> NA, 2, 2, 2, NA, 2, 2, 2, 2, 2…
$ native_americaninuit_32_03              <dbl> NA, NA, NA, NA, NA, NA, NA, NA…
$ blackafrican_american_32_04             <dbl> 4, NA, NA, NA, 4, NA, NA, NA, …
$ other_32_05                             <dbl> NA, NA, NA, NA, NA, NA, NA, NA…
$ please_define_other_32_5                <chr> NA, NA, NA, NA, NA, NA, NA, NA…
$ are_you_of_hispanic_latino_or_spa_33    <dbl> 2, 2, 1, 2, 2, 2, 2, 2, 2, 2, …
$ primary_language                        <chr> "English", "English", "English…
$ please_define_other_34_3                <chr> NA, NA, NA, NA, NA, NA, NA, NA…
$ how_might_we_better_provide_service_34a <chr> NA, NA, NA, NA, NA, NA, NA, NA…
$ would_you_say_your_total_annual_hous_35 <dbl> 1, 2, NA, NA, 3, 4, 3, 3, NA, …
$ city                                    <chr> "Durham", "Durham", "Durham", …
$ state                                   <chr> "NC", "NC", "NC", "NC", "NC", …
$ zip                                     <dbl> 27712, 27705, 27703, 27713, 27…
$ pac_zone                                <dbl> NA, 2, NA, 4, 4, NA, 4, NA, 3,…
$ inside_city_of_durham                   <chr> "N", "Y", "N", "Y", "Y", "N", …
$ block_lon                               <dbl> -78877000, -78920000, -7875600…
$ block_lat                               <dbl> 36087000, 36022000, 35927000, …
Finish up
Go to ae-06 to pick up where we left off and continue improving.
Step 1:
Step 2:
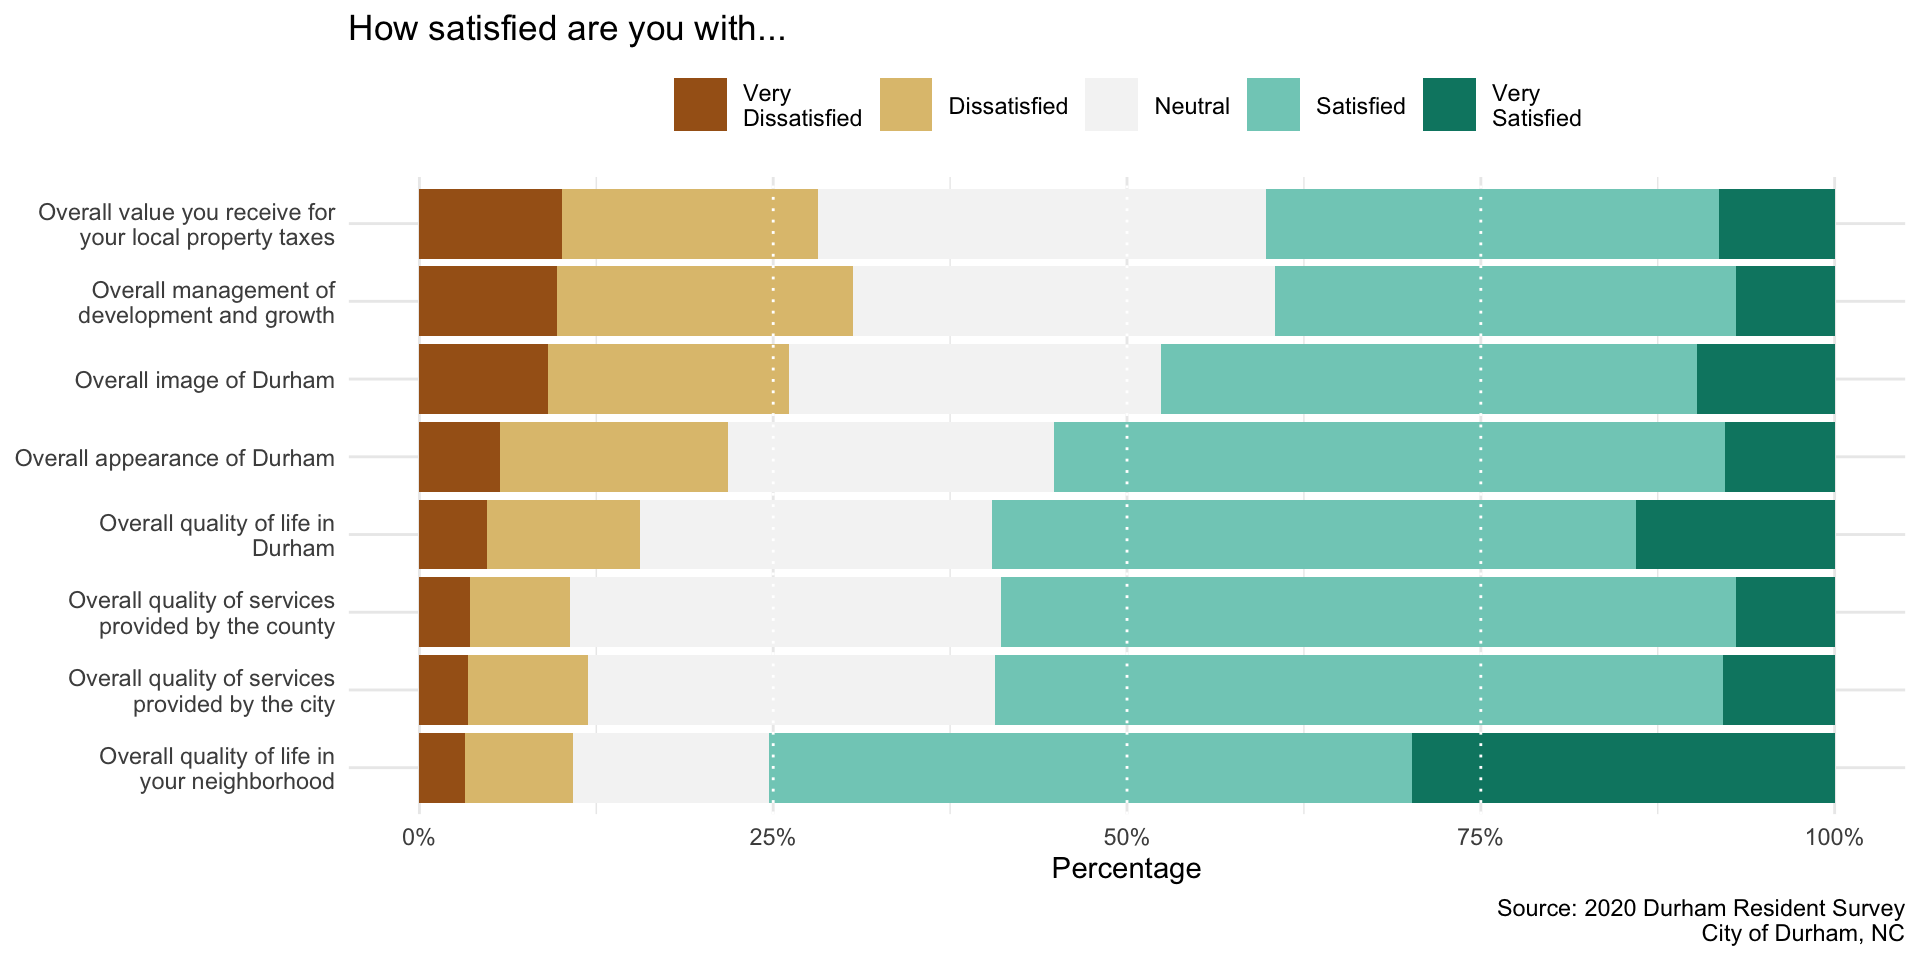
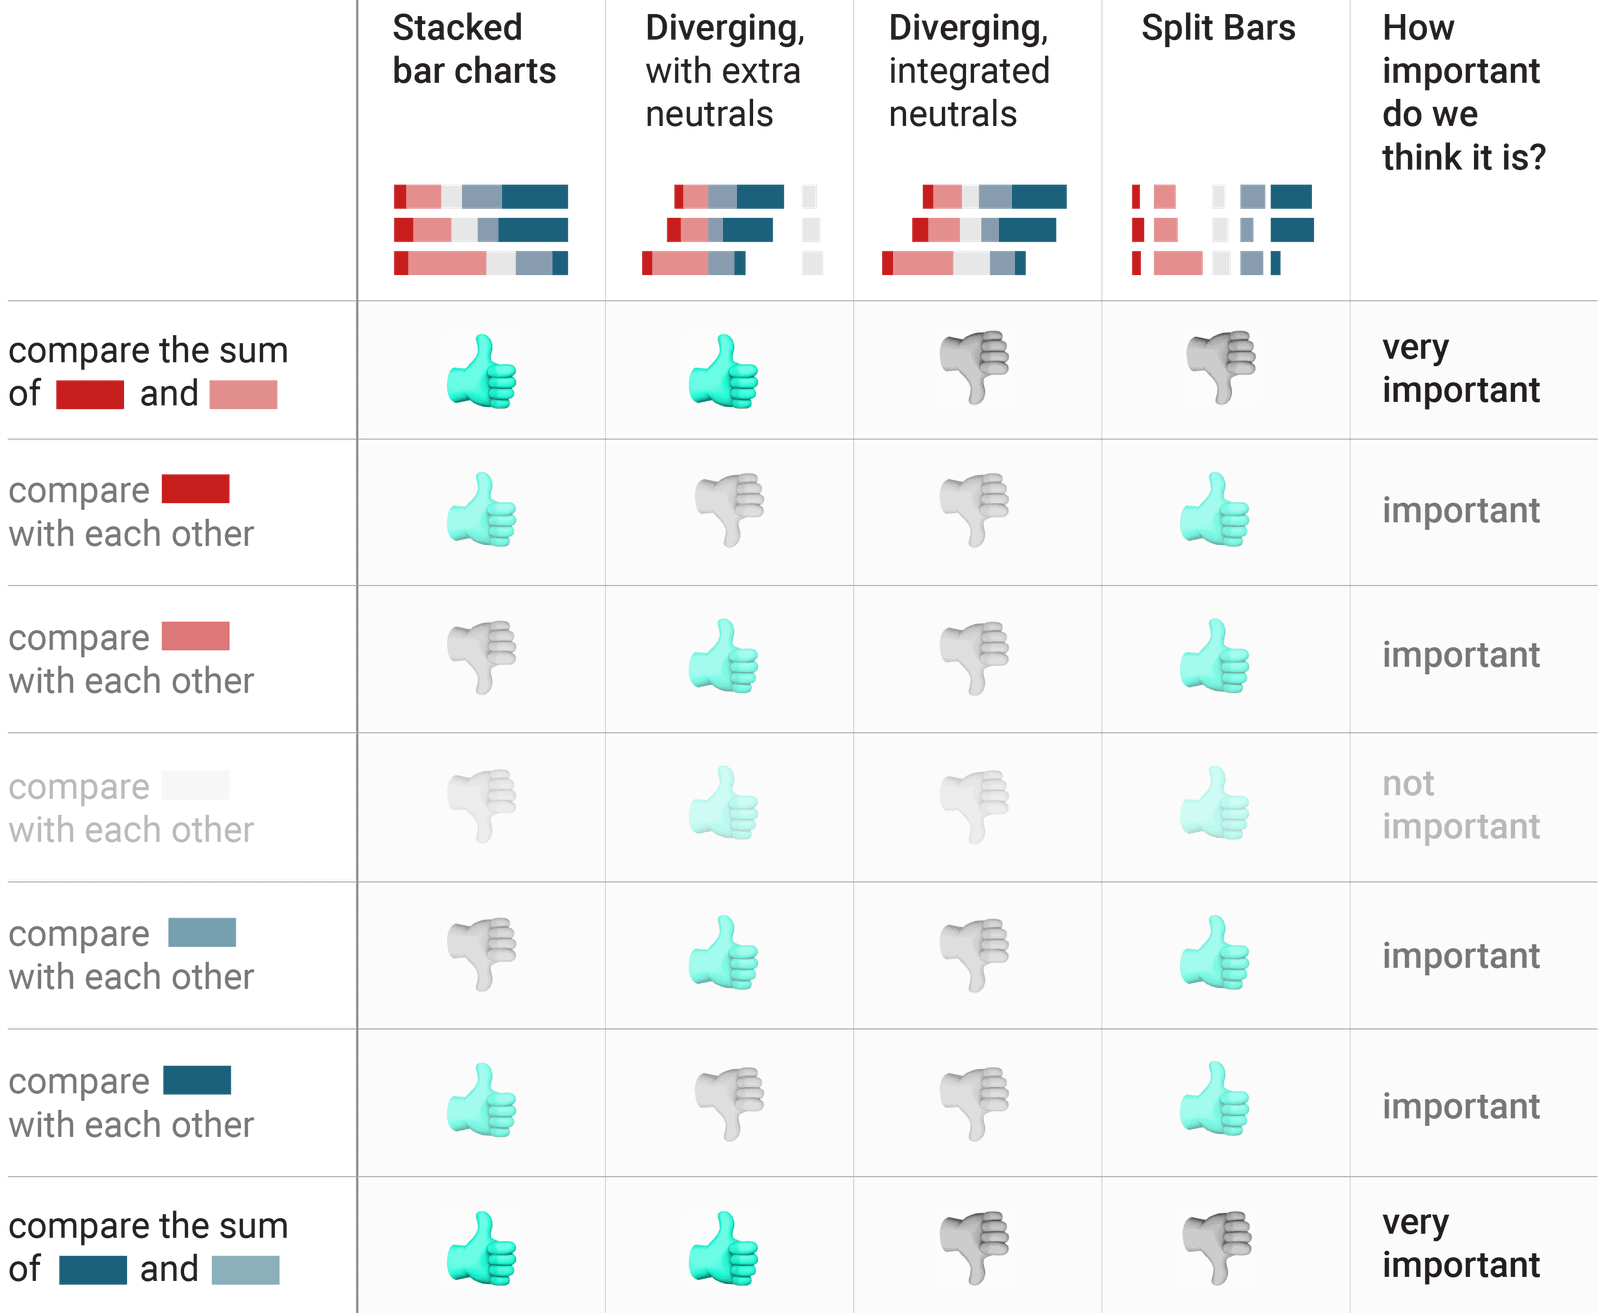
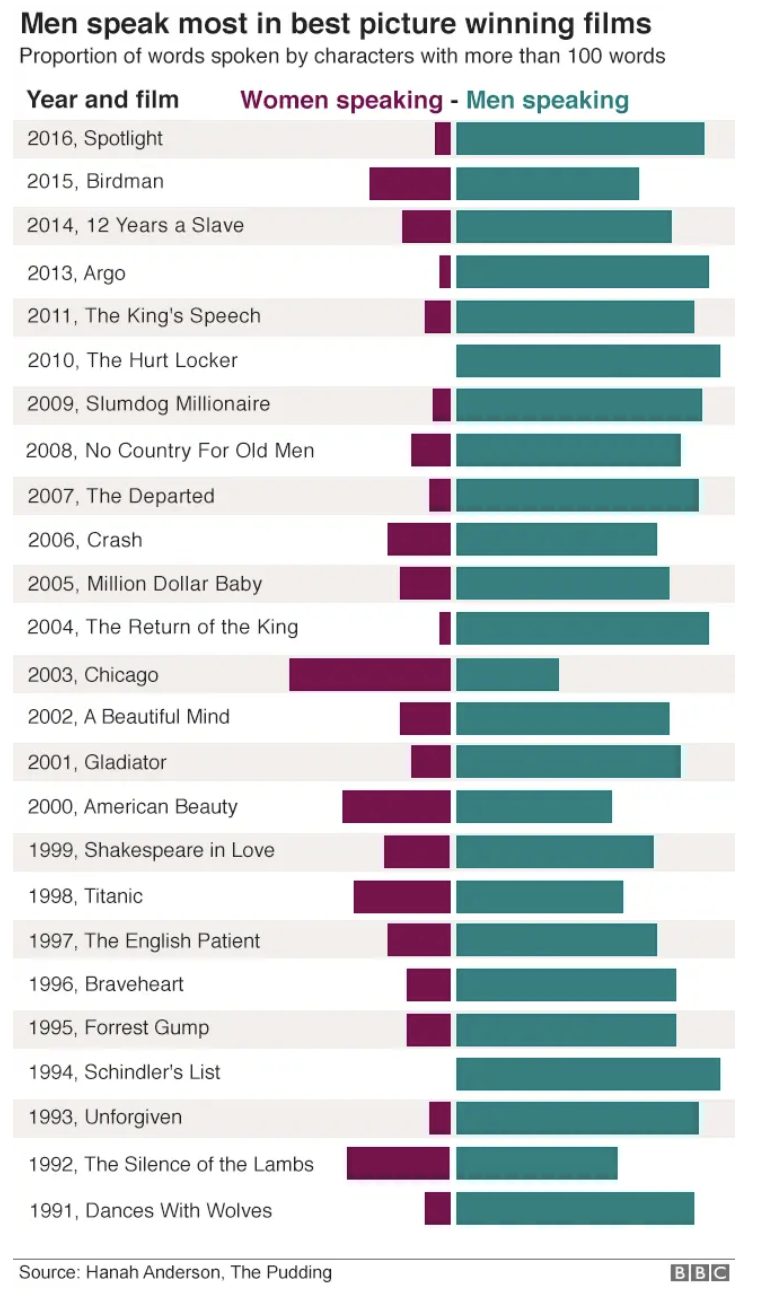
Diverging bar charts
vs. 100% bar charts
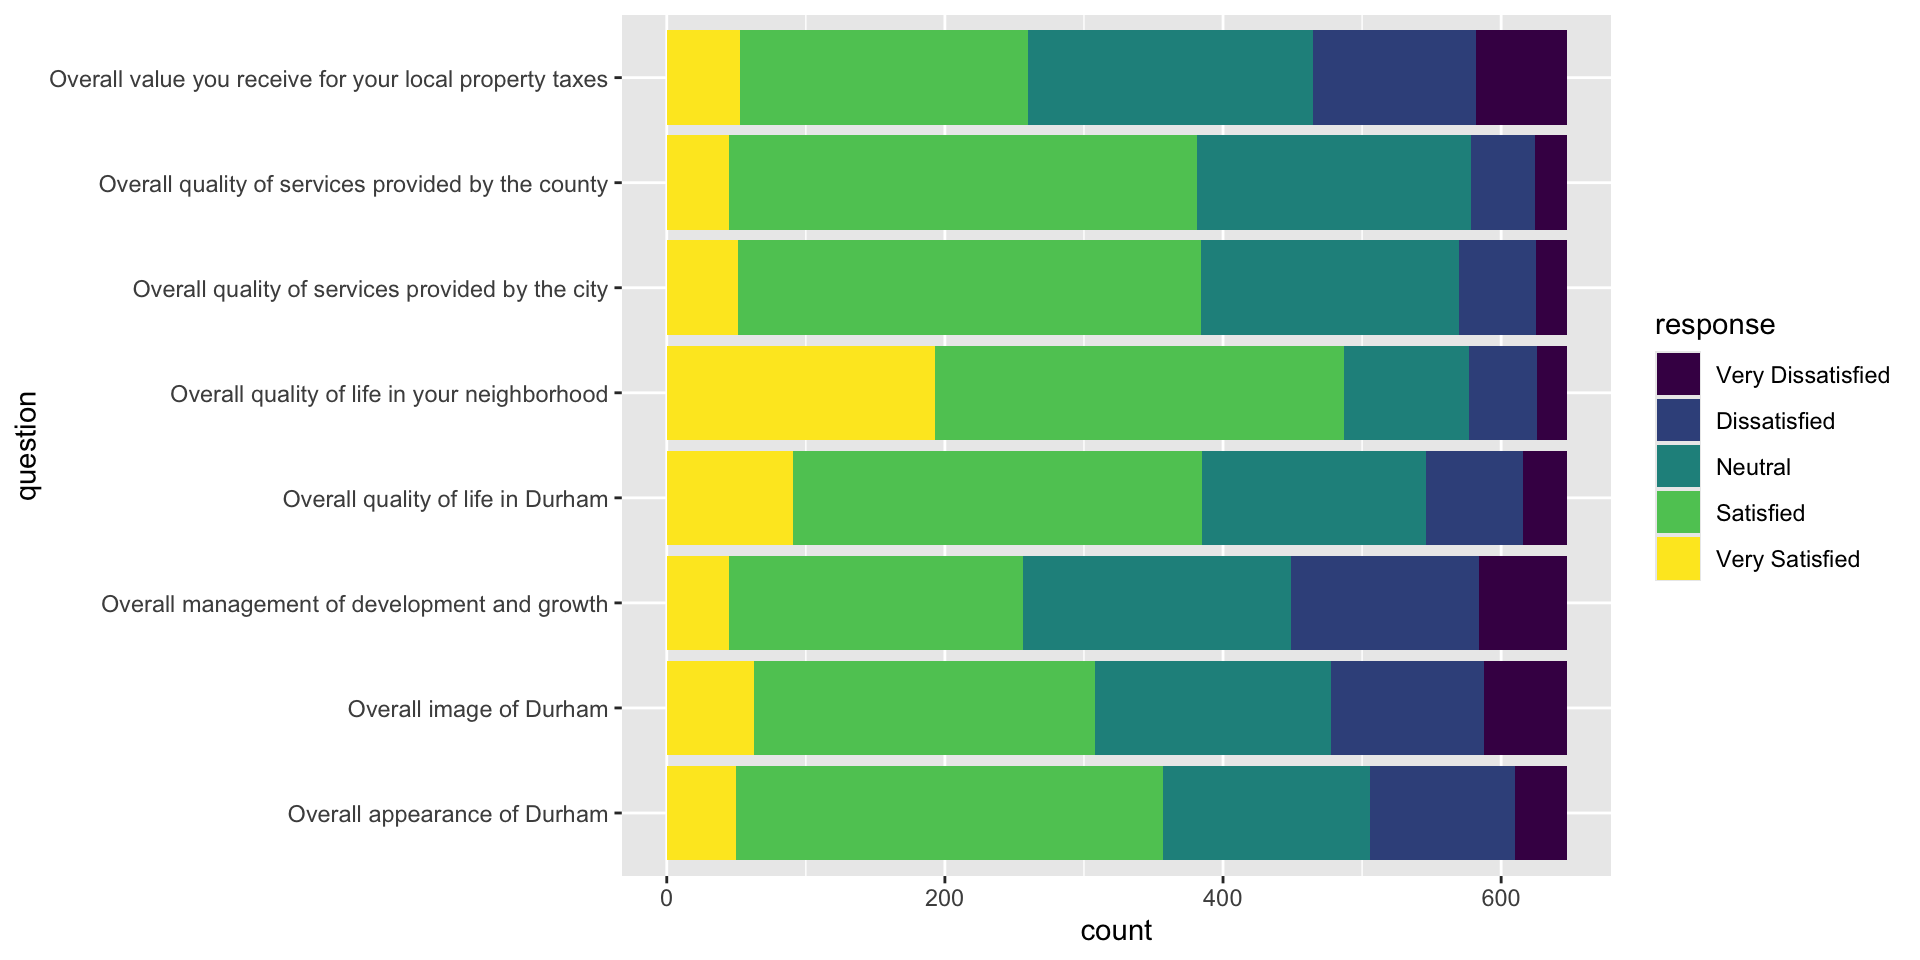
Let’s make a divergent bar chart
Go back to ae-06 and add a divergent bar chart.
Comparison