Welcome to STA 313
Lecture 2
Teaching team
Teaching assistants

Leah Johnson
Head TA +
Lab 1 TA

Luxman Maheswaran
Lab 2 TA
Alexa Fahrer
ggplot2 ∈ tidyverse
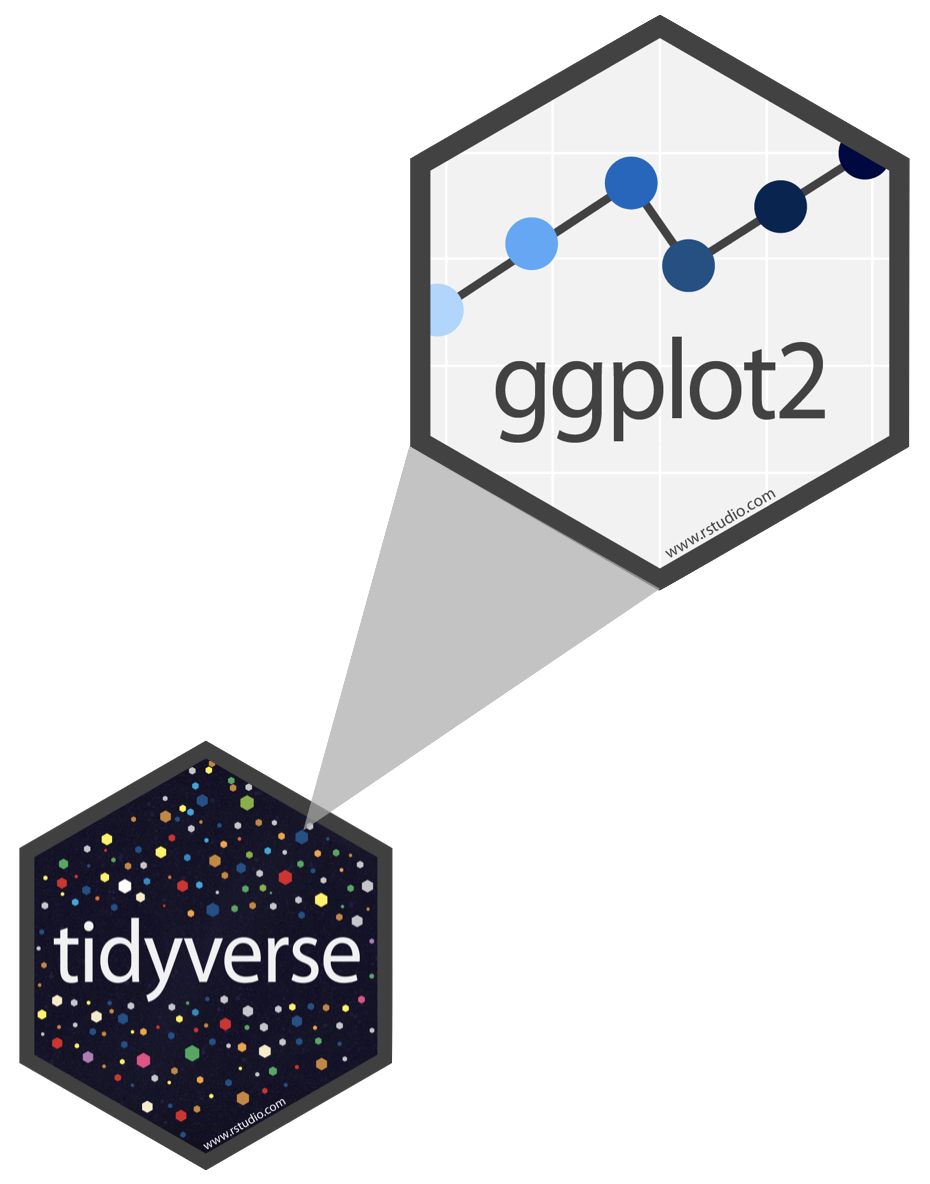
ggplot2 is tidyverse’s data visualization package
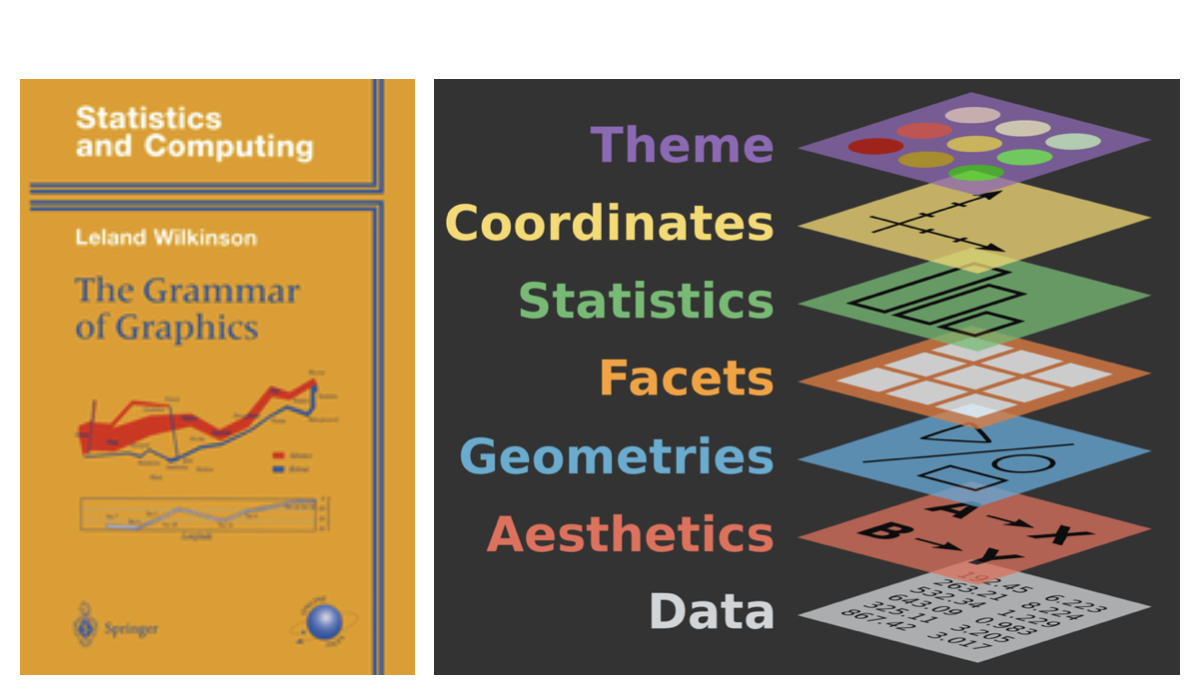
ggin “ggplot2” stands for Grammar of GraphicsInspired by the book Grammar of Graphics by Leland Wilkinson
Grammar of Graphics
A grammar of graphics is a tool that enables us to concisely describe the components of a graphic
Data: Palmer Penguins
Measurements for penguin species, island in Palmer Archipelago, size (flipper length, body mass, bill dimensions), and sex.
Attaching package: 'palmerpenguins'The following objects are masked from 'package:datasets':
penguins, penguins_rawRows: 344
Columns: 8
$ species <fct> Adelie, Adelie, Adelie, Adelie, Adelie, Adelie, Adel…
$ island <fct> Torgersen, Torgersen, Torgersen, Torgersen, Torgerse…
$ bill_length_mm <dbl> 39.1, 39.5, 40.3, NA, 36.7, 39.3, 38.9, 39.2, 34.1, …
$ bill_depth_mm <dbl> 18.7, 17.4, 18.0, NA, 19.3, 20.6, 17.8, 19.6, 18.1, …
$ flipper_length_mm <int> 181, 186, 195, NA, 193, 190, 181, 195, 193, 190, 186…
$ body_mass_g <int> 3750, 3800, 3250, NA, 3450, 3650, 3625, 4675, 3475, …
$ sex <fct> male, female, female, NA, female, male, female, male…
$ year <int> 2007, 2007, 2007, 2007, 2007, 2007, 2007, 2007, 2007…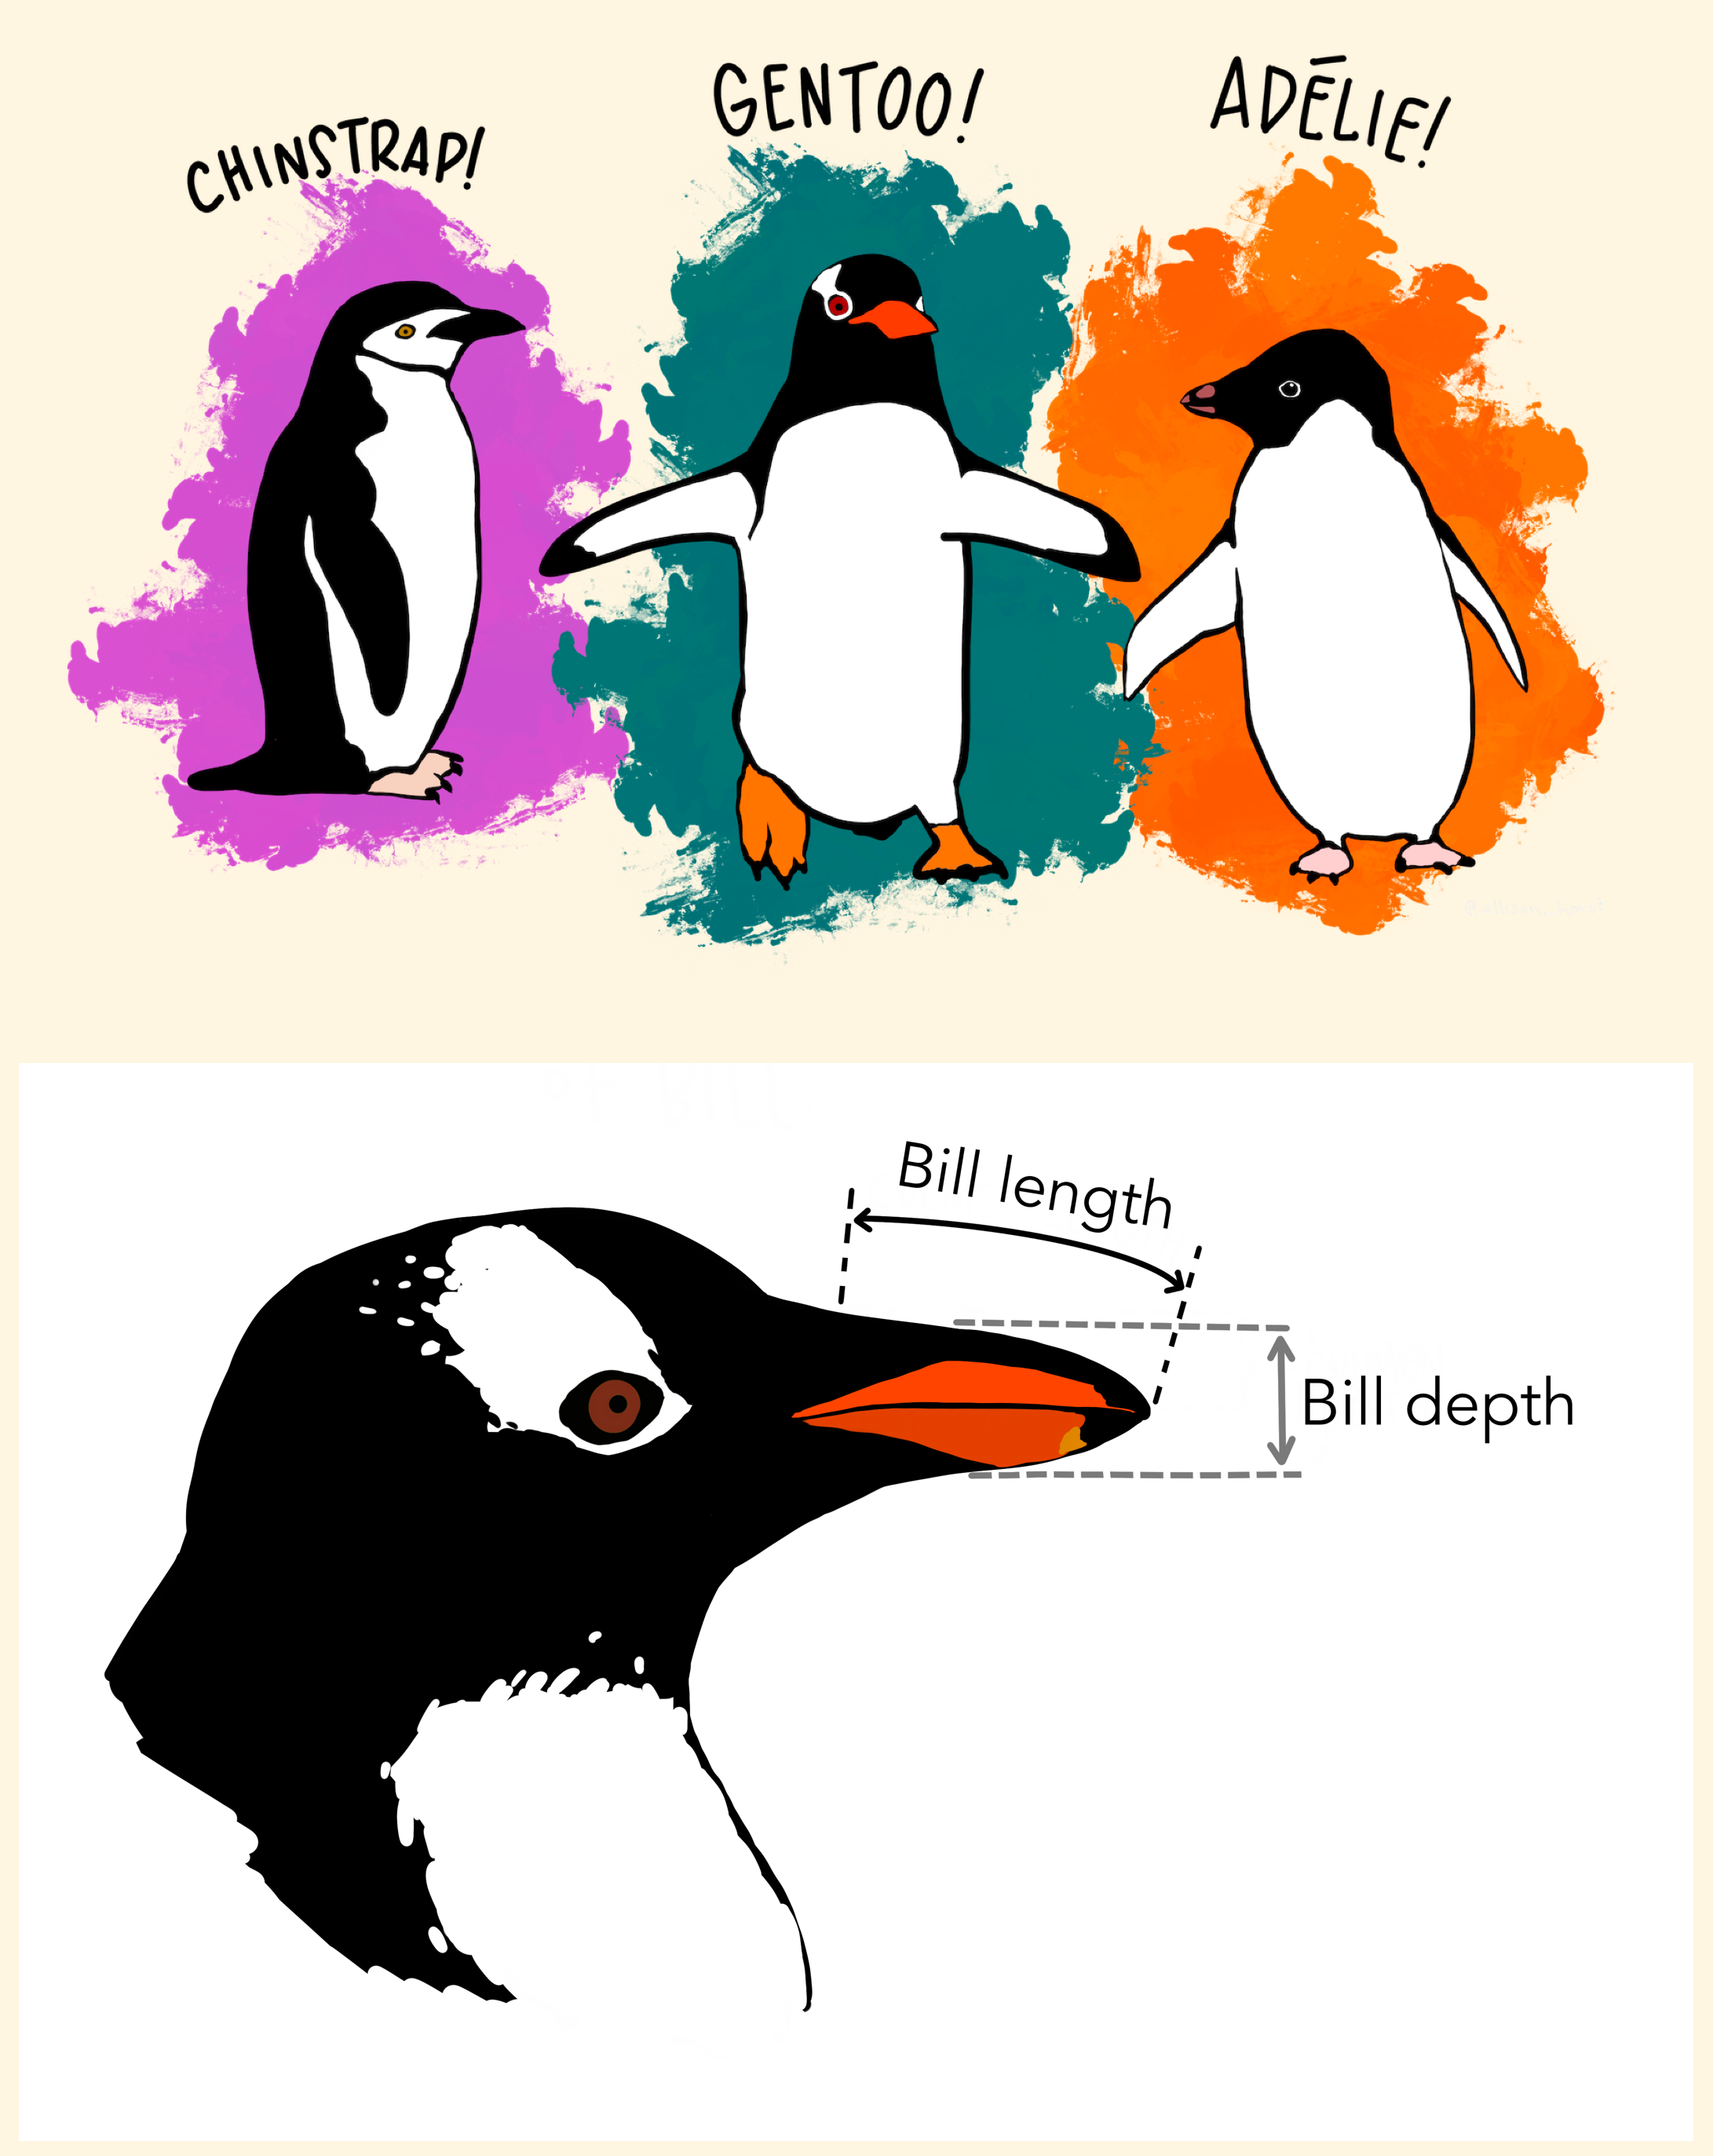
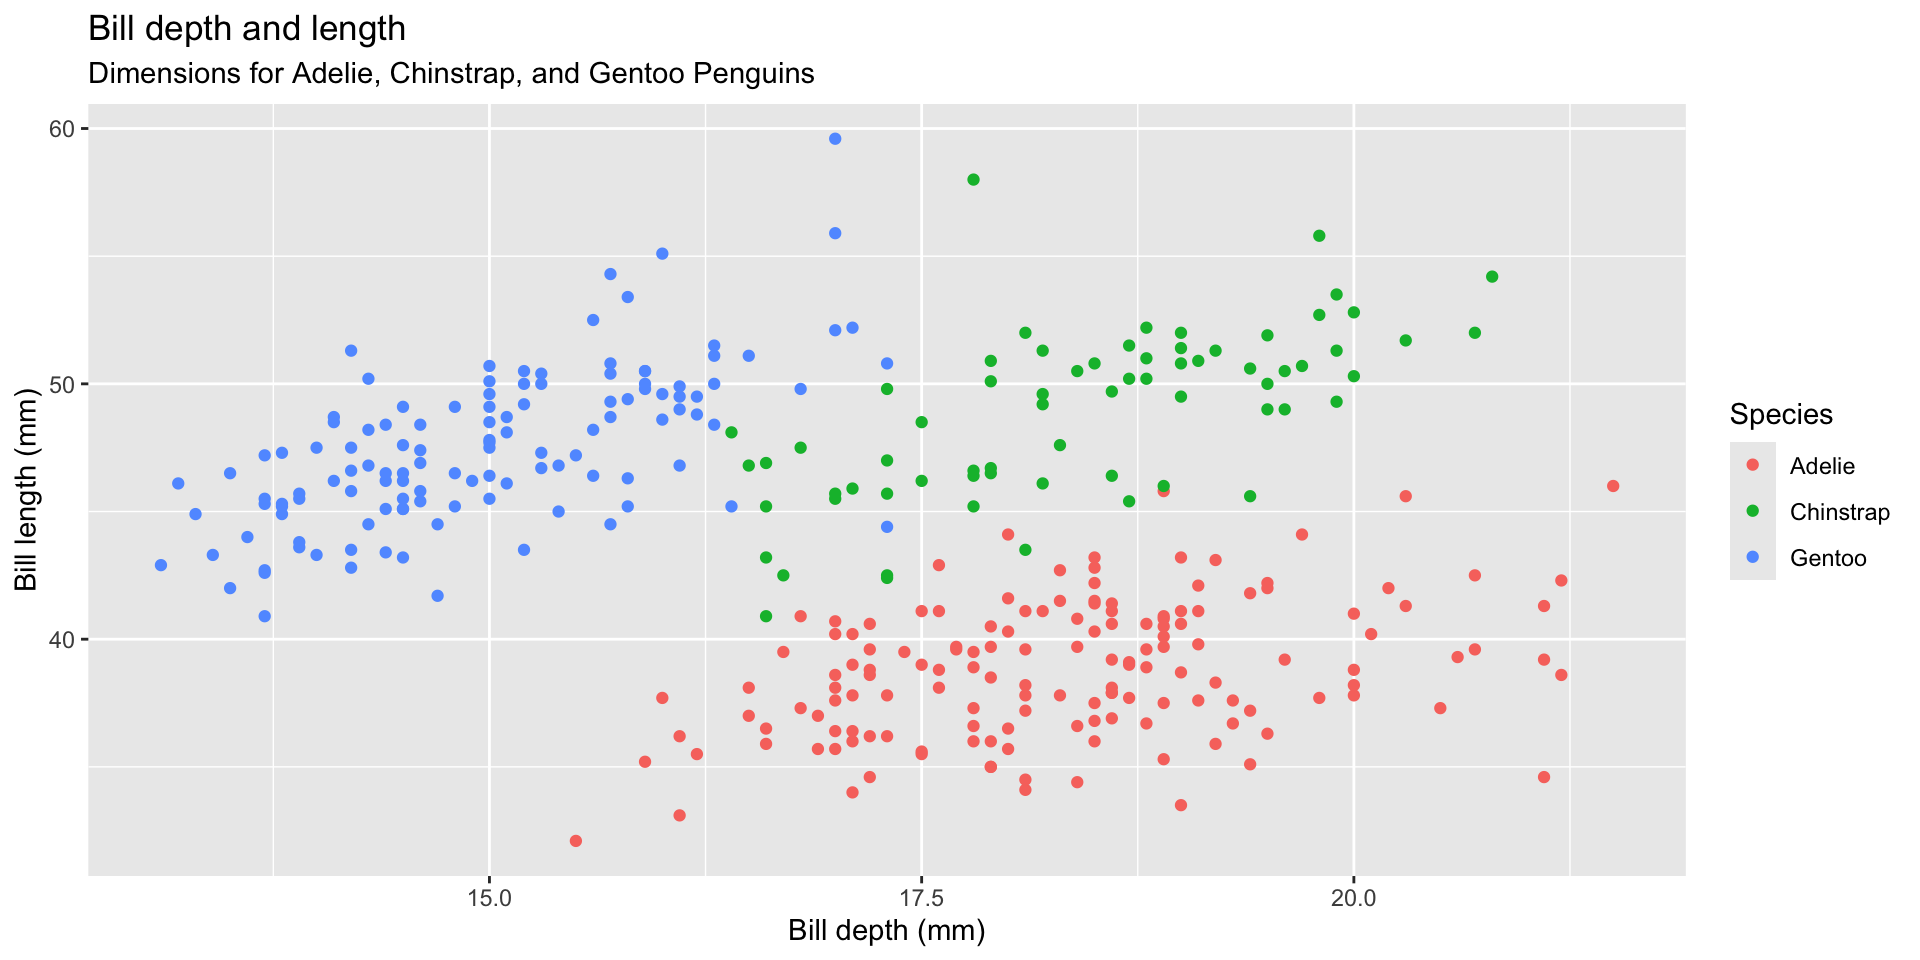
Goal
An improved goal
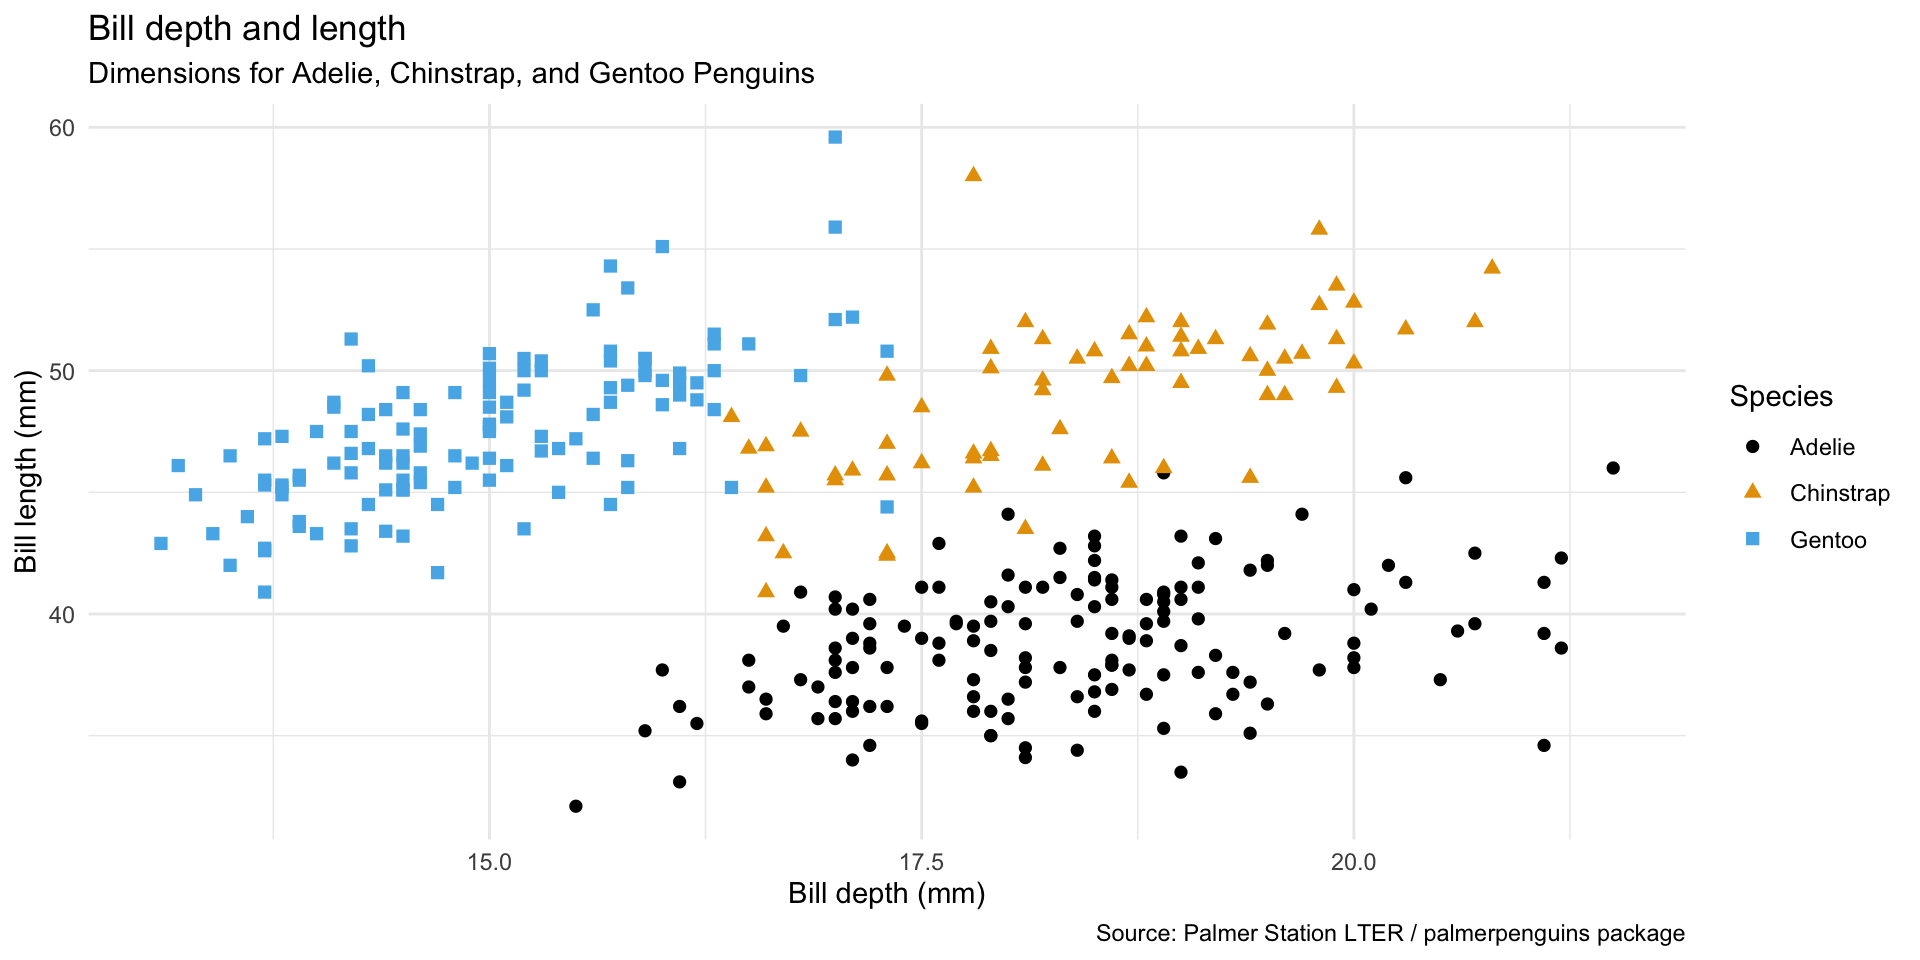
ggplot(
  penguins,
  aes(x = bill_depth_mm, y = bill_length_mm, color = species, shape = species)) +
  geom_point(size = 2) +
  labs(
    title = "Bill depth and length",
    subtitle = "Dimensions for Adelie, Chinstrap, and Gentoo Penguins",
    x = "Bill depth (mm)", y = "Bill length (mm)",
    color = "Species",
    shape = "Species",
    caption = "Source: Palmer Station LTER / palmerpenguins package"
  ) +
  theme_minimal() +
  ggthemes::scale_color_colorblind()
Start with the penguins data frame, map bill depth to the x-axis and map bill length to the y-axis.
Represent each observation with a point and map species to the color and shape of each point.
Title the plot “Bill depth and length”, add the subtitle “Dimensions for Adelie, Chinstrap, and Gentoo Penguins”, label the x and y axes as “Bill depth (mm)” and “Bill length (mm)”, respectively, label the legend “Species”, and add a caption for the data source.
Finally, use a discrete color scale that is designed to be perceived by viewers with common forms of color blindness.