# load packages
library(countdown)
library(tidyverse)
library(janitor)
library(colorspace)
library(fs)
library(palmerpenguins)
library(ThemePark)
library(ggthemes)
library(duke)
library(tidykids)
library(openintro)
library(glue)

# set theme for ggplot2
ggplot2::theme_set(ggplot2::theme_minimal(base_size = 18))

# set figure parameters for knitr
knitr::opts_chunk$set(
  fig.width = 7, # 7" width
  fig.asp = 0.618, # the golden ratio
  fig.retina = 3, # dpi multiplier for displaying HTML output on retina
  fig.align = "center", # center align figures
  dpi = 300 # higher dpi, sharper image
)
Themes + axes + annotation
Lecture 7
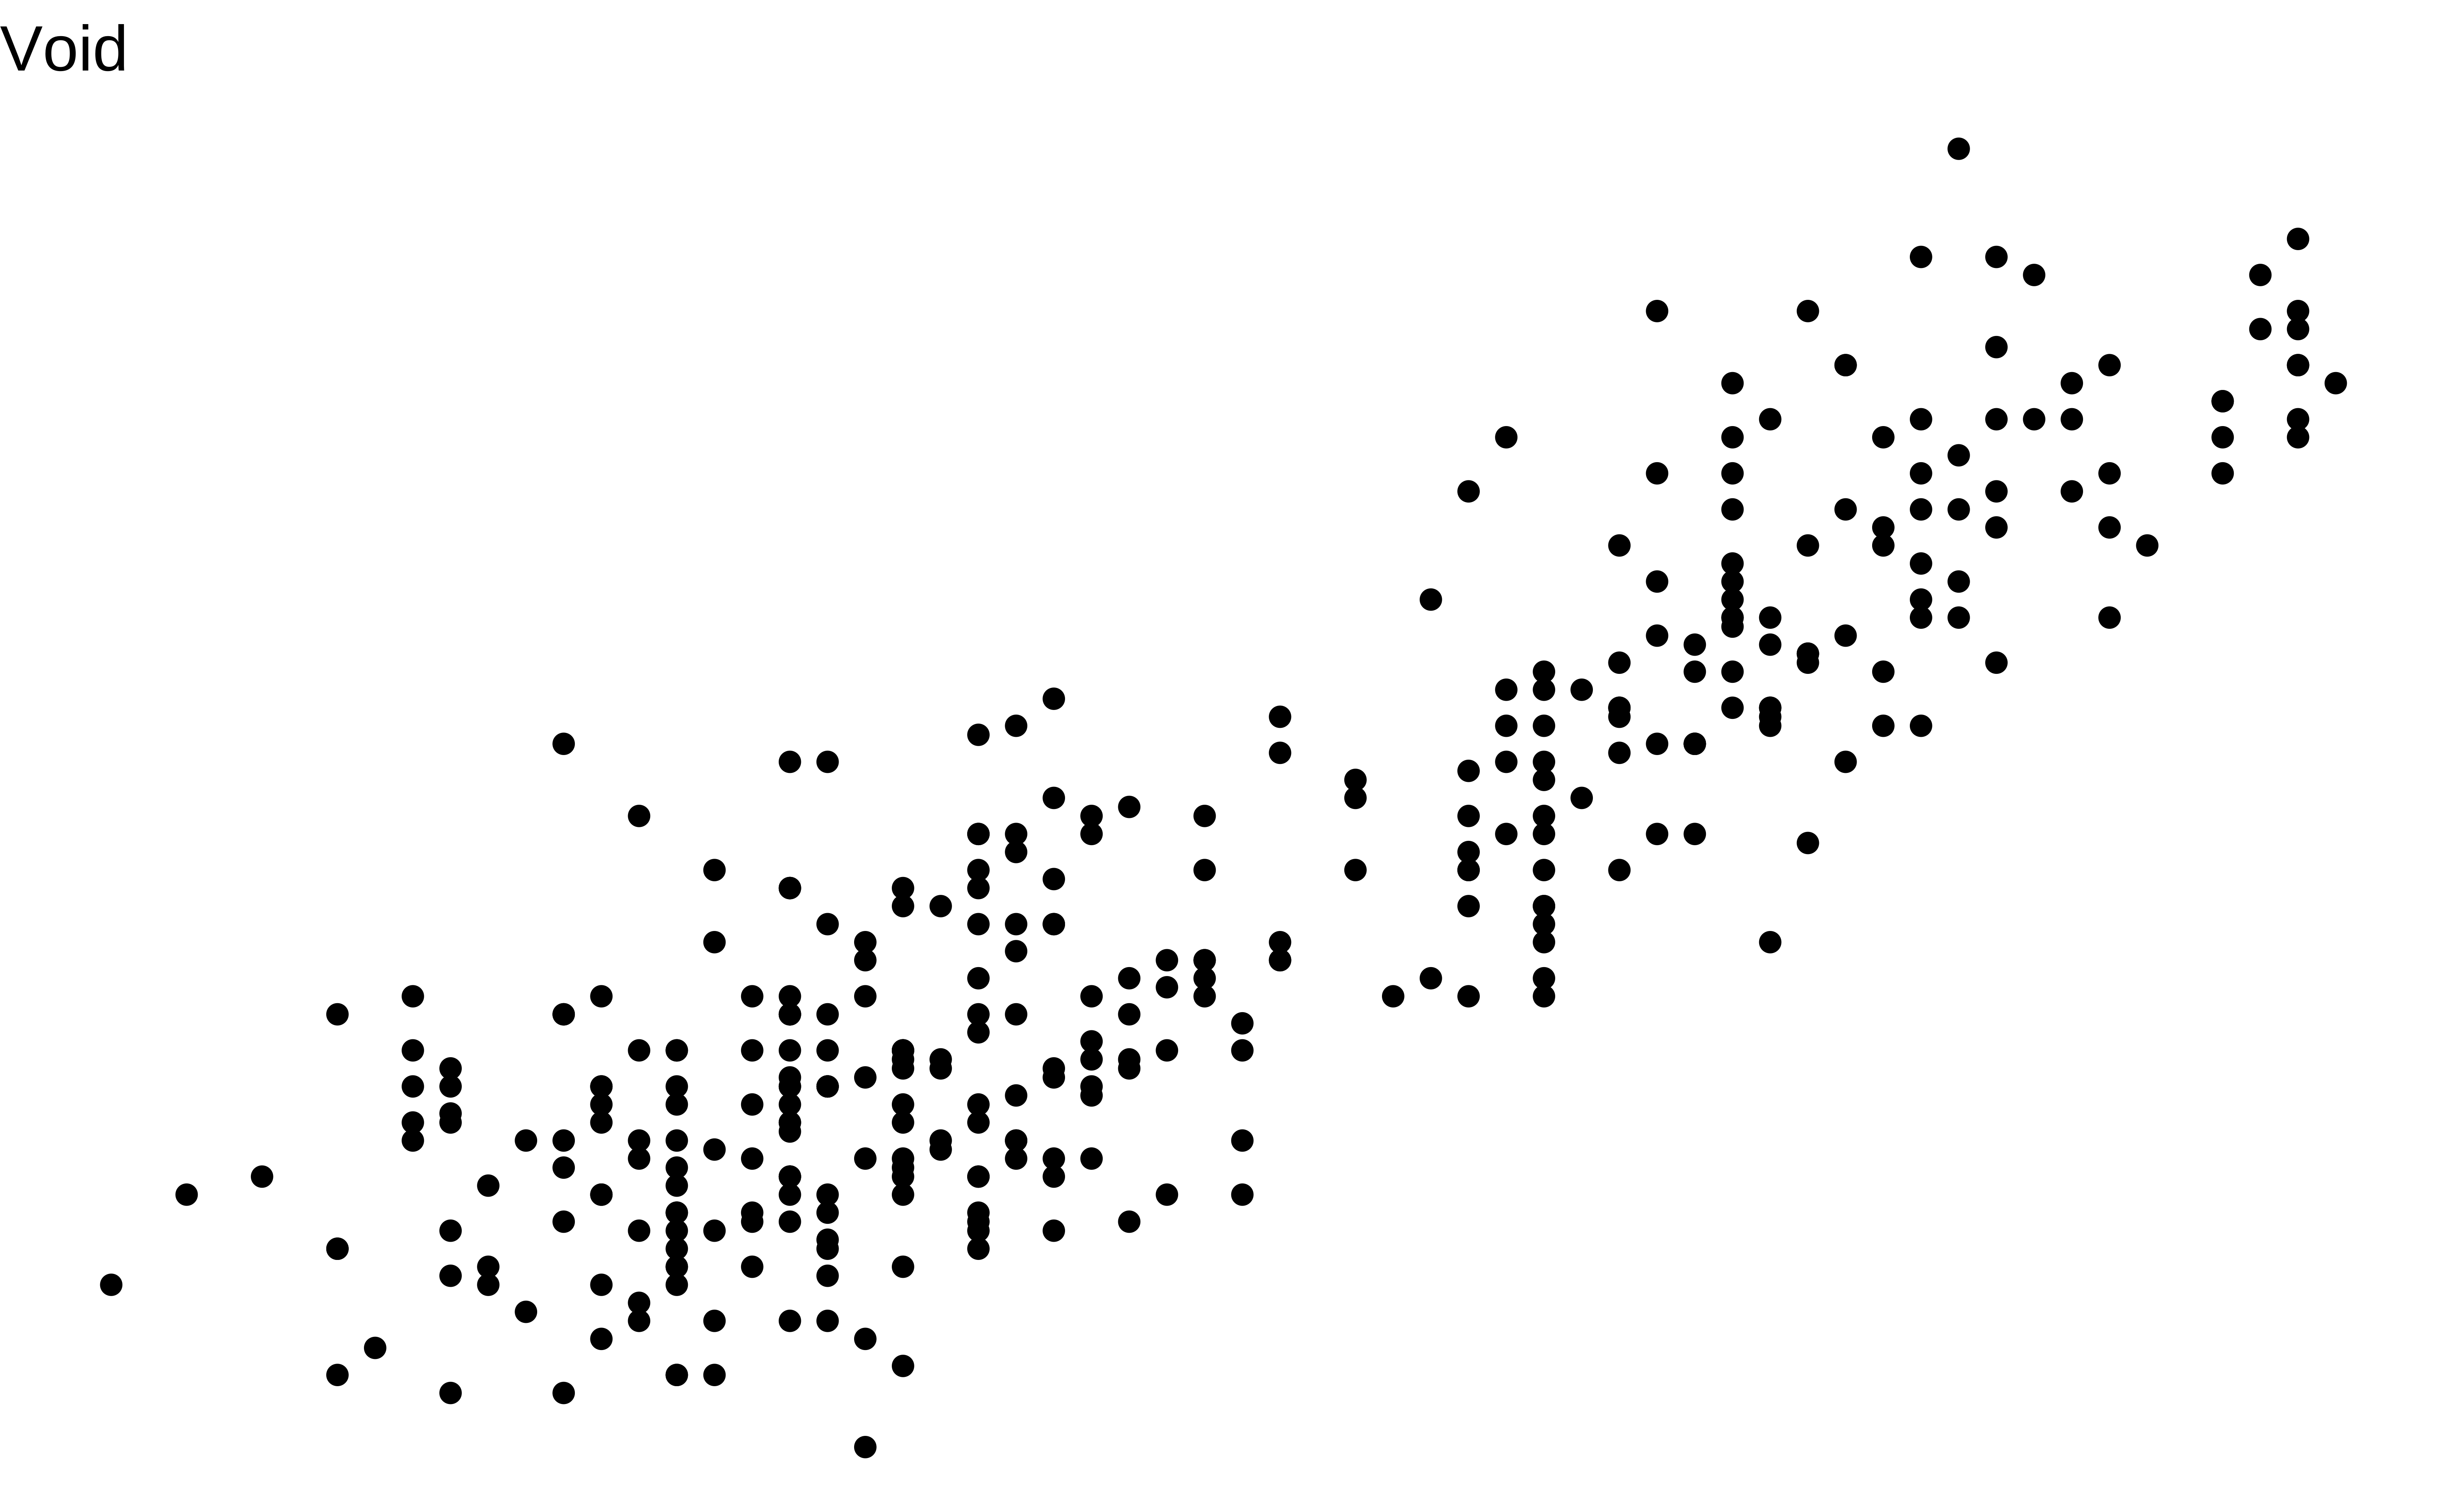
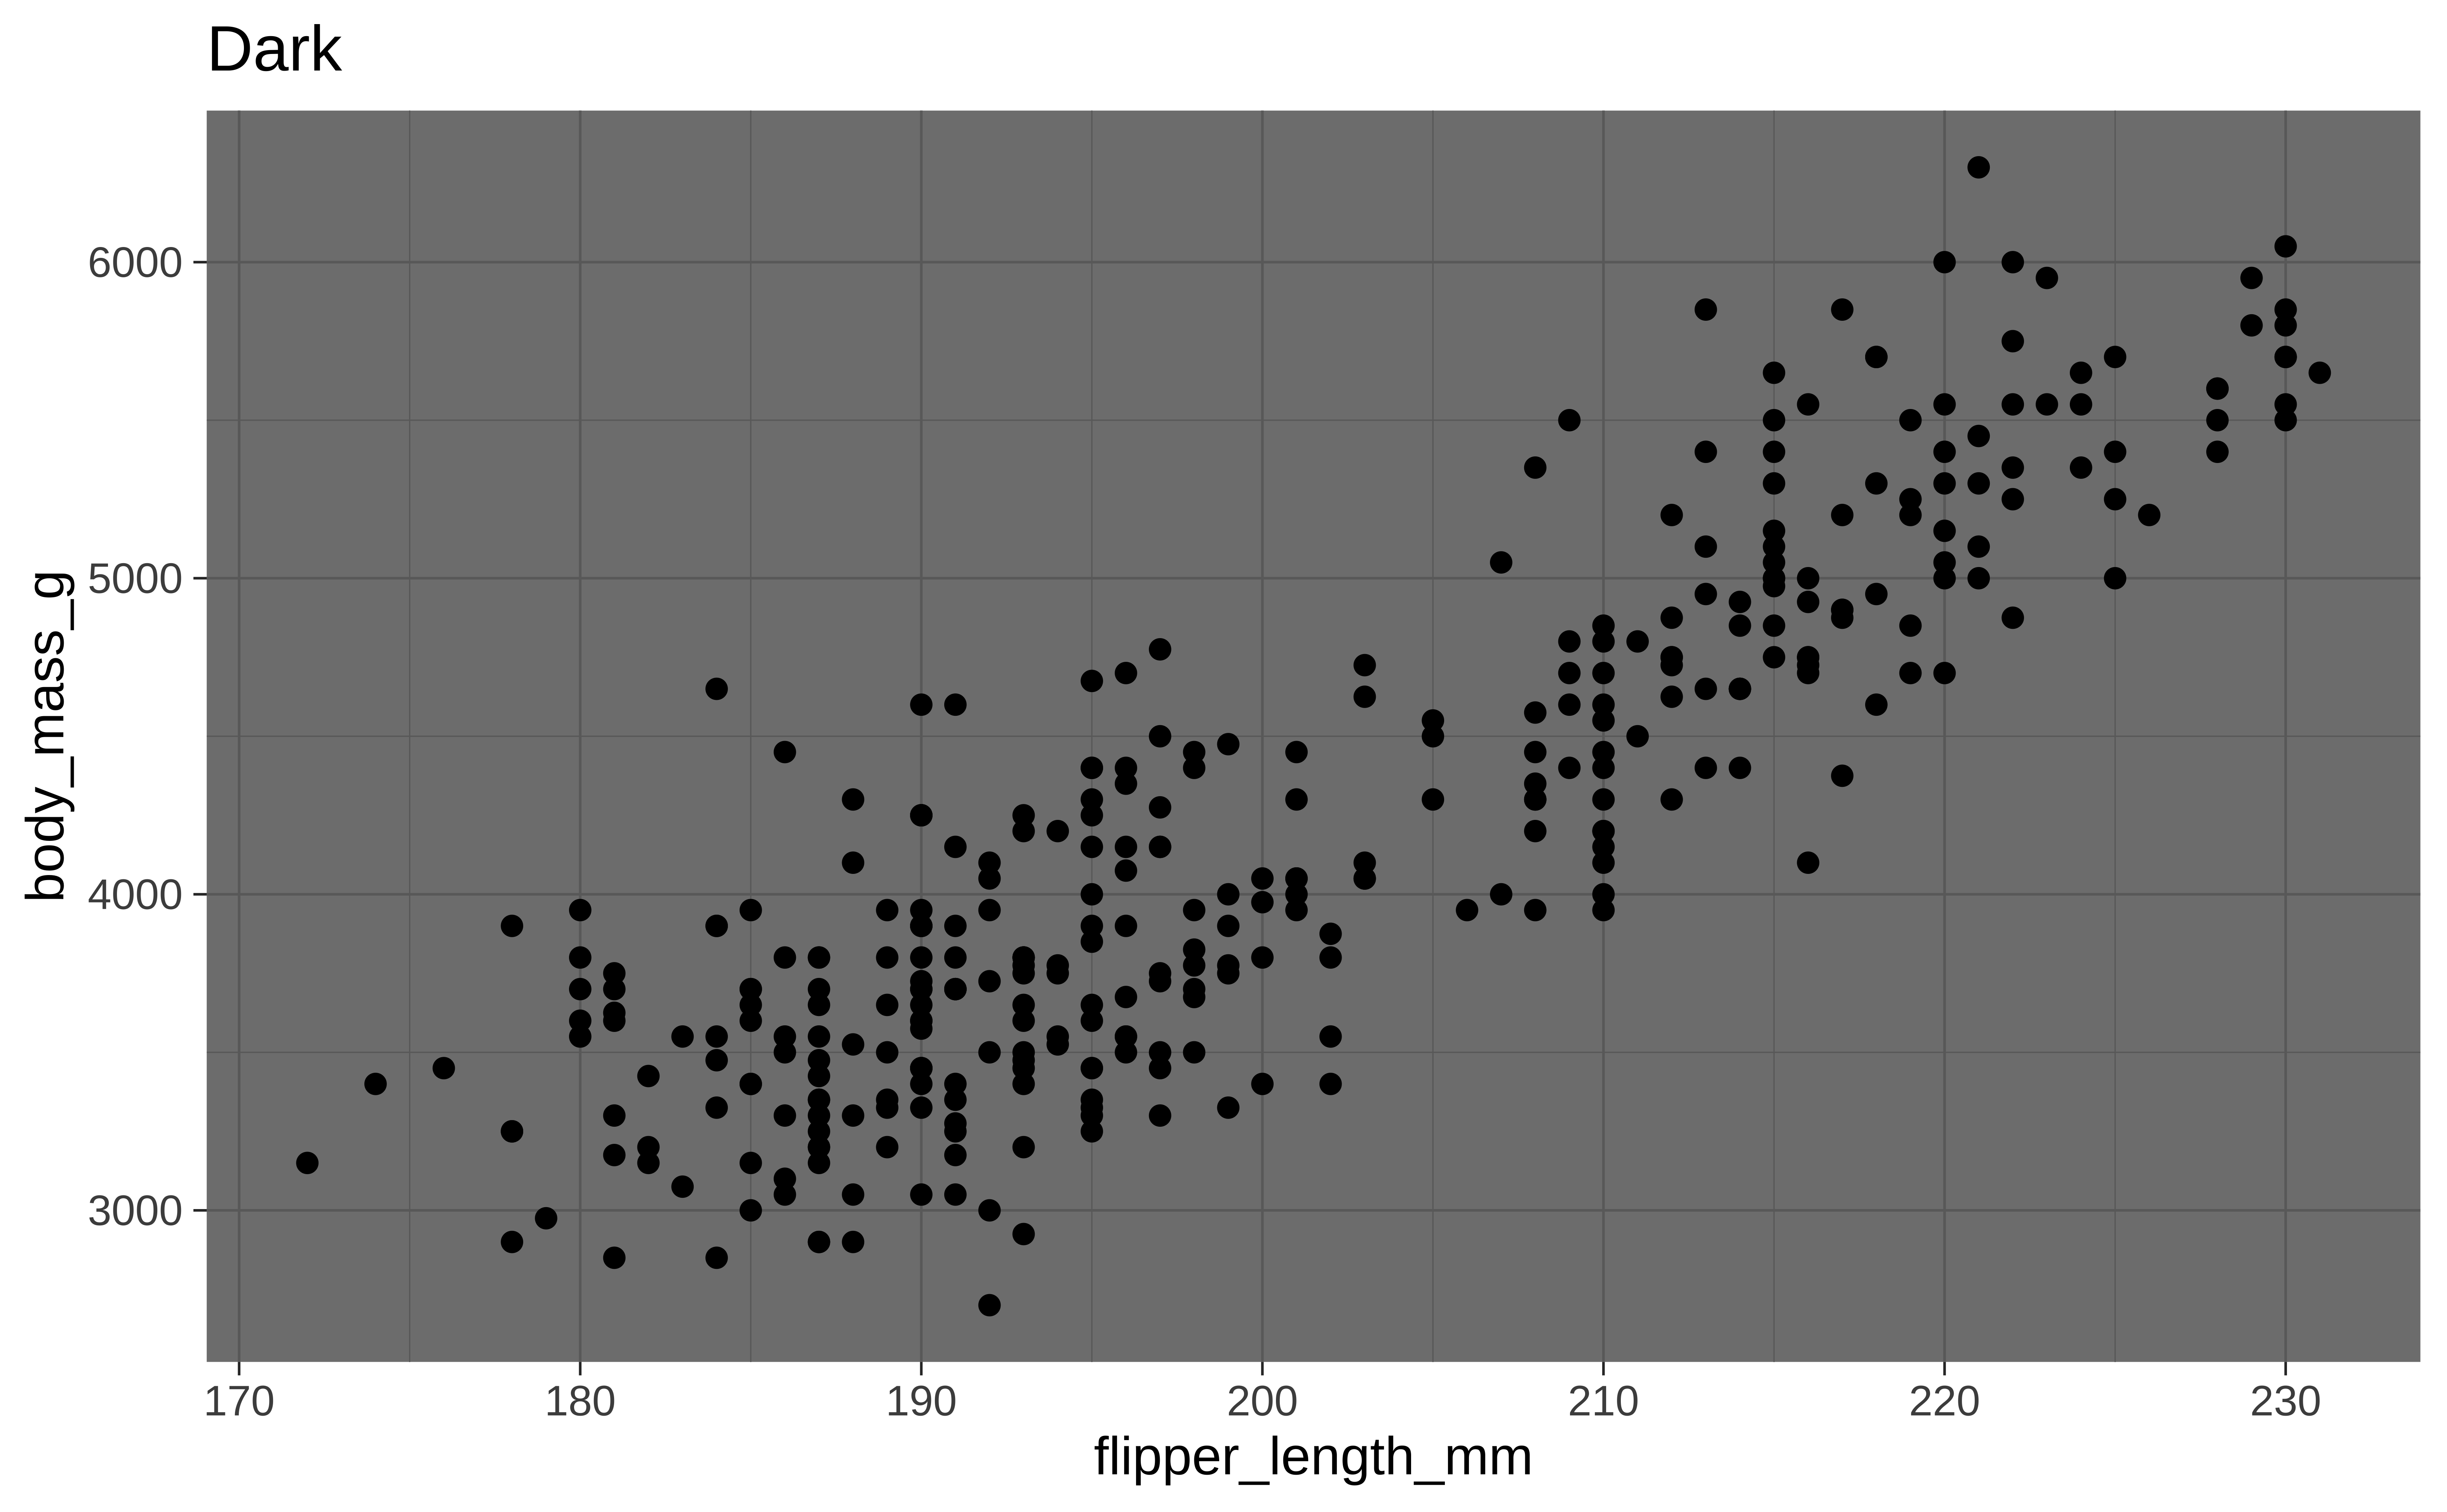
Complete themes
p <- ggplot(penguins, aes(x = flipper_length_mm, y = body_mass_g)) +
geom_point()
p + theme_gray() + labs(title = "Gray")
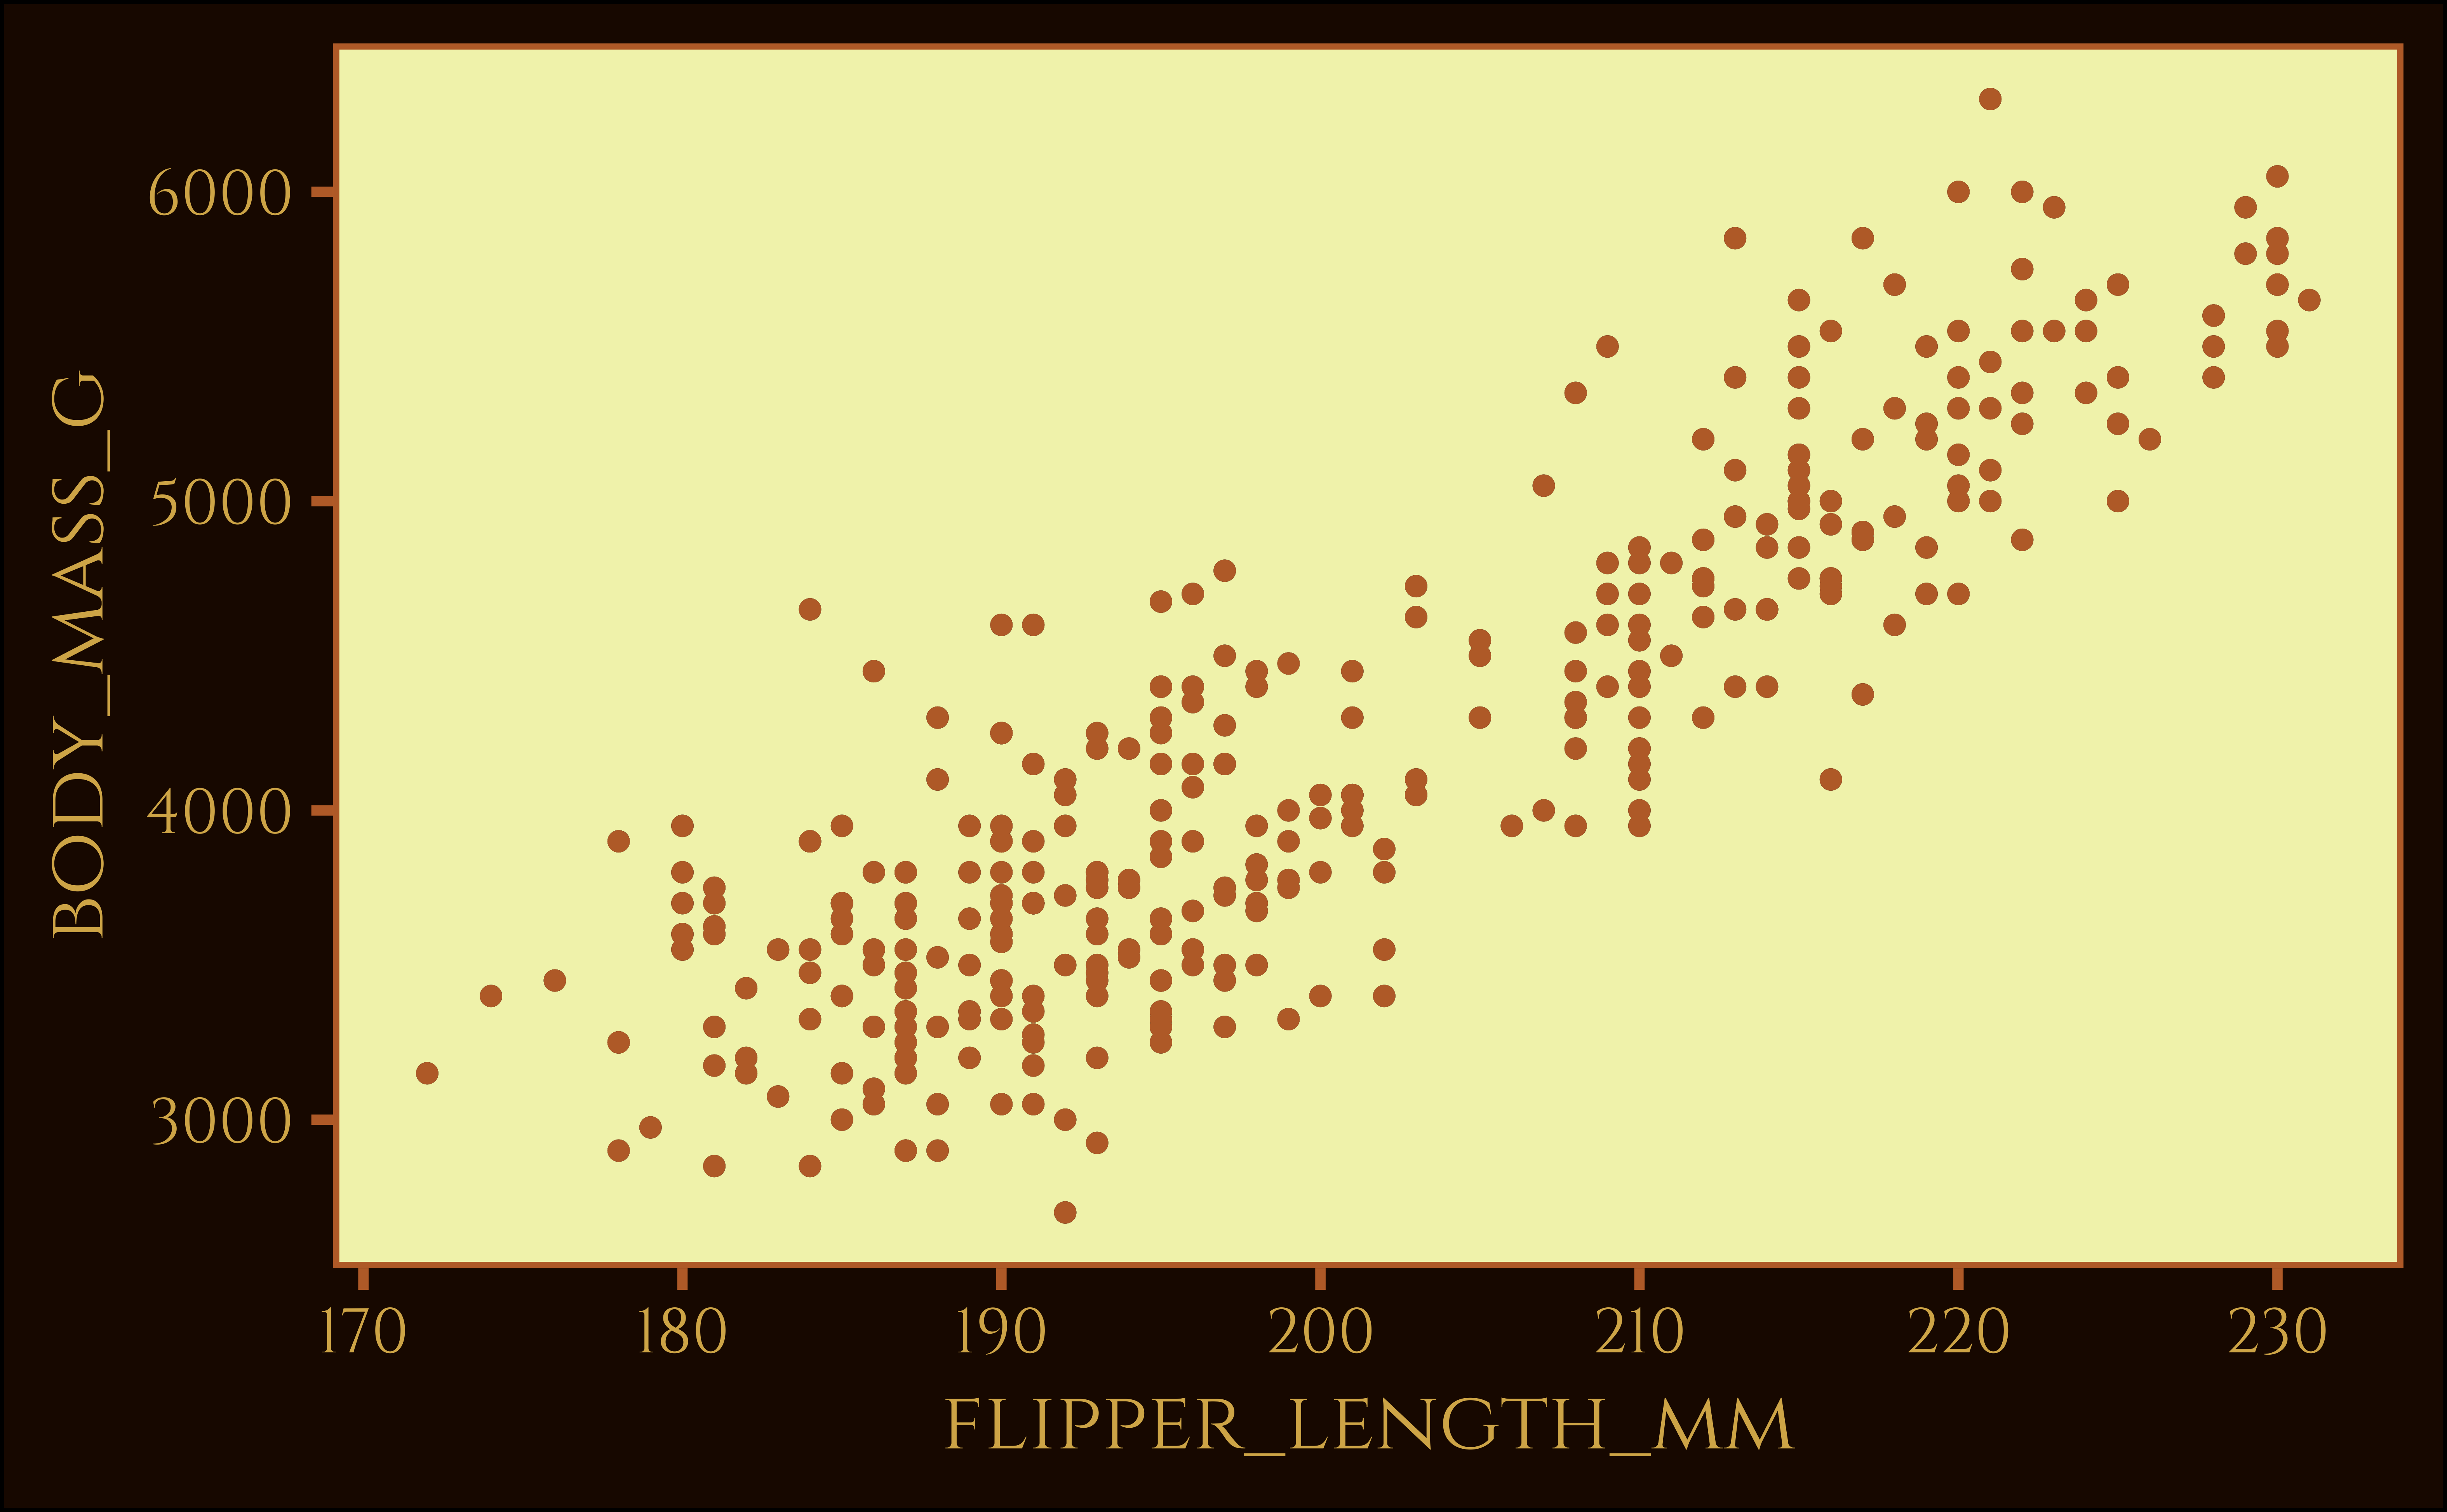
p + theme_void() + labs(title = "Void")
p + theme_dark() + labs(title = "Dark")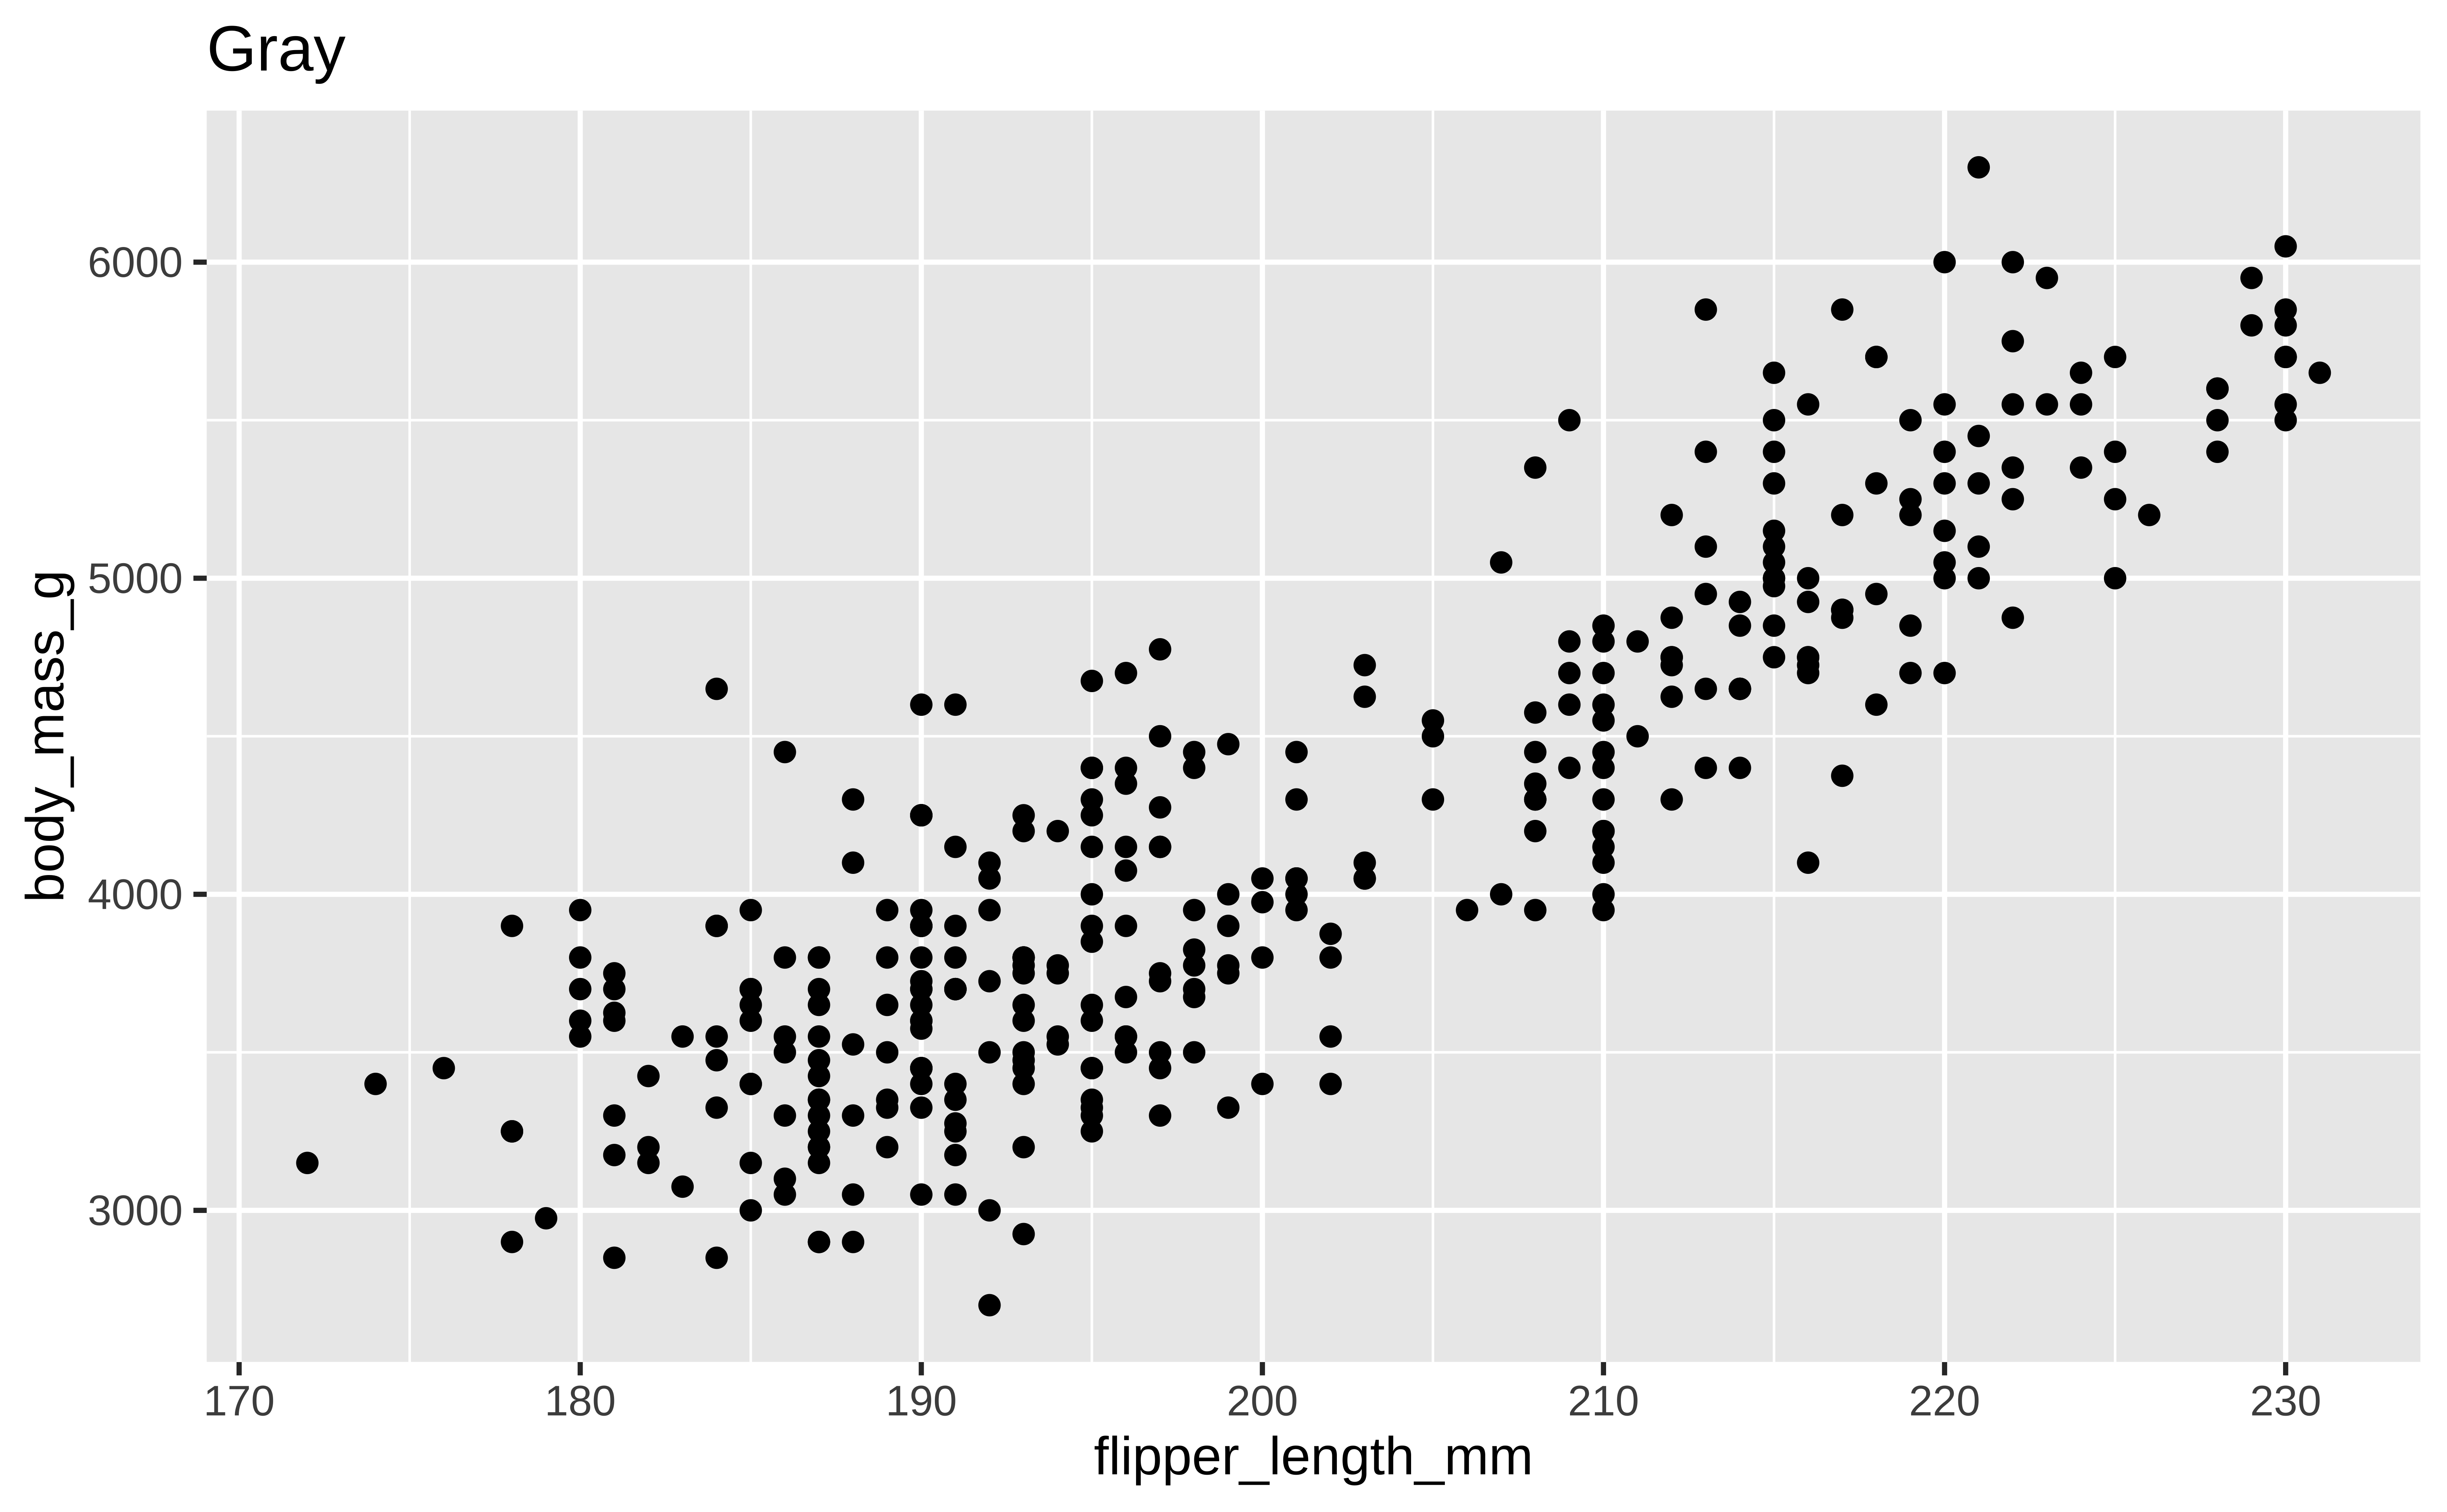
Themes from ggthemes
p + theme_fivethirtyeight() + labs(title = "FiveThirtyEight")
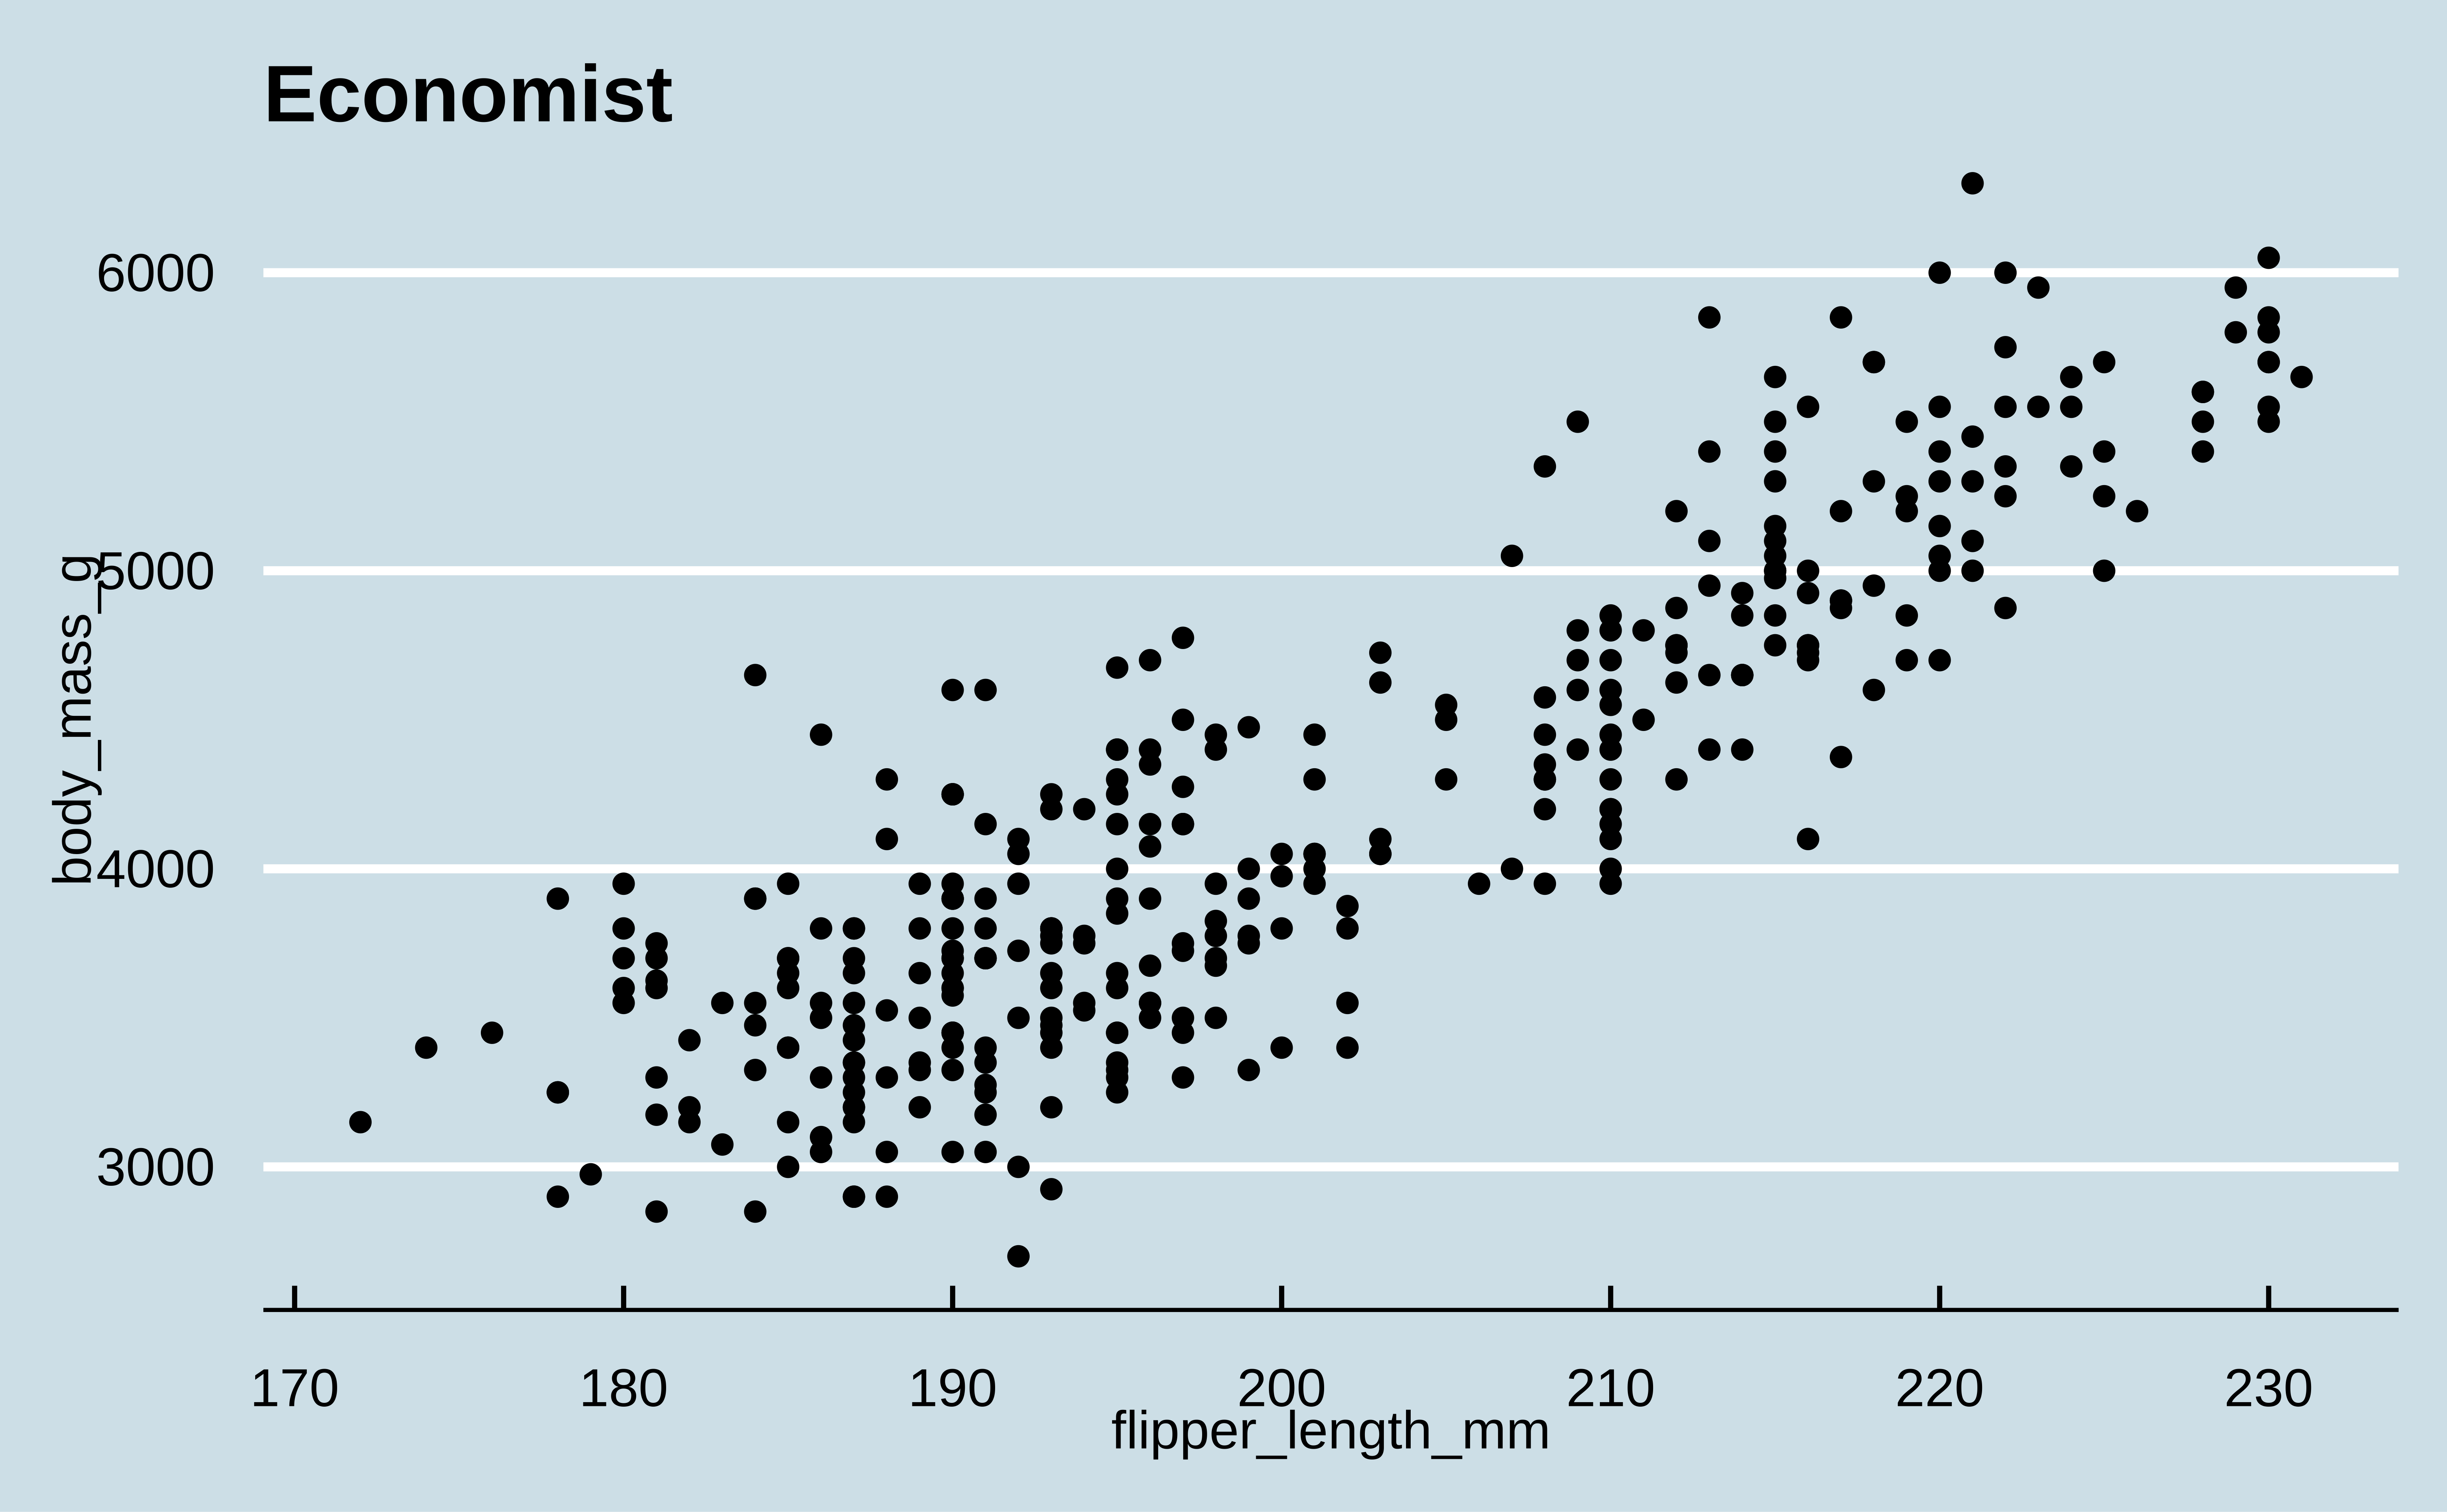
p + theme_economist() + labs(title = "Economist")
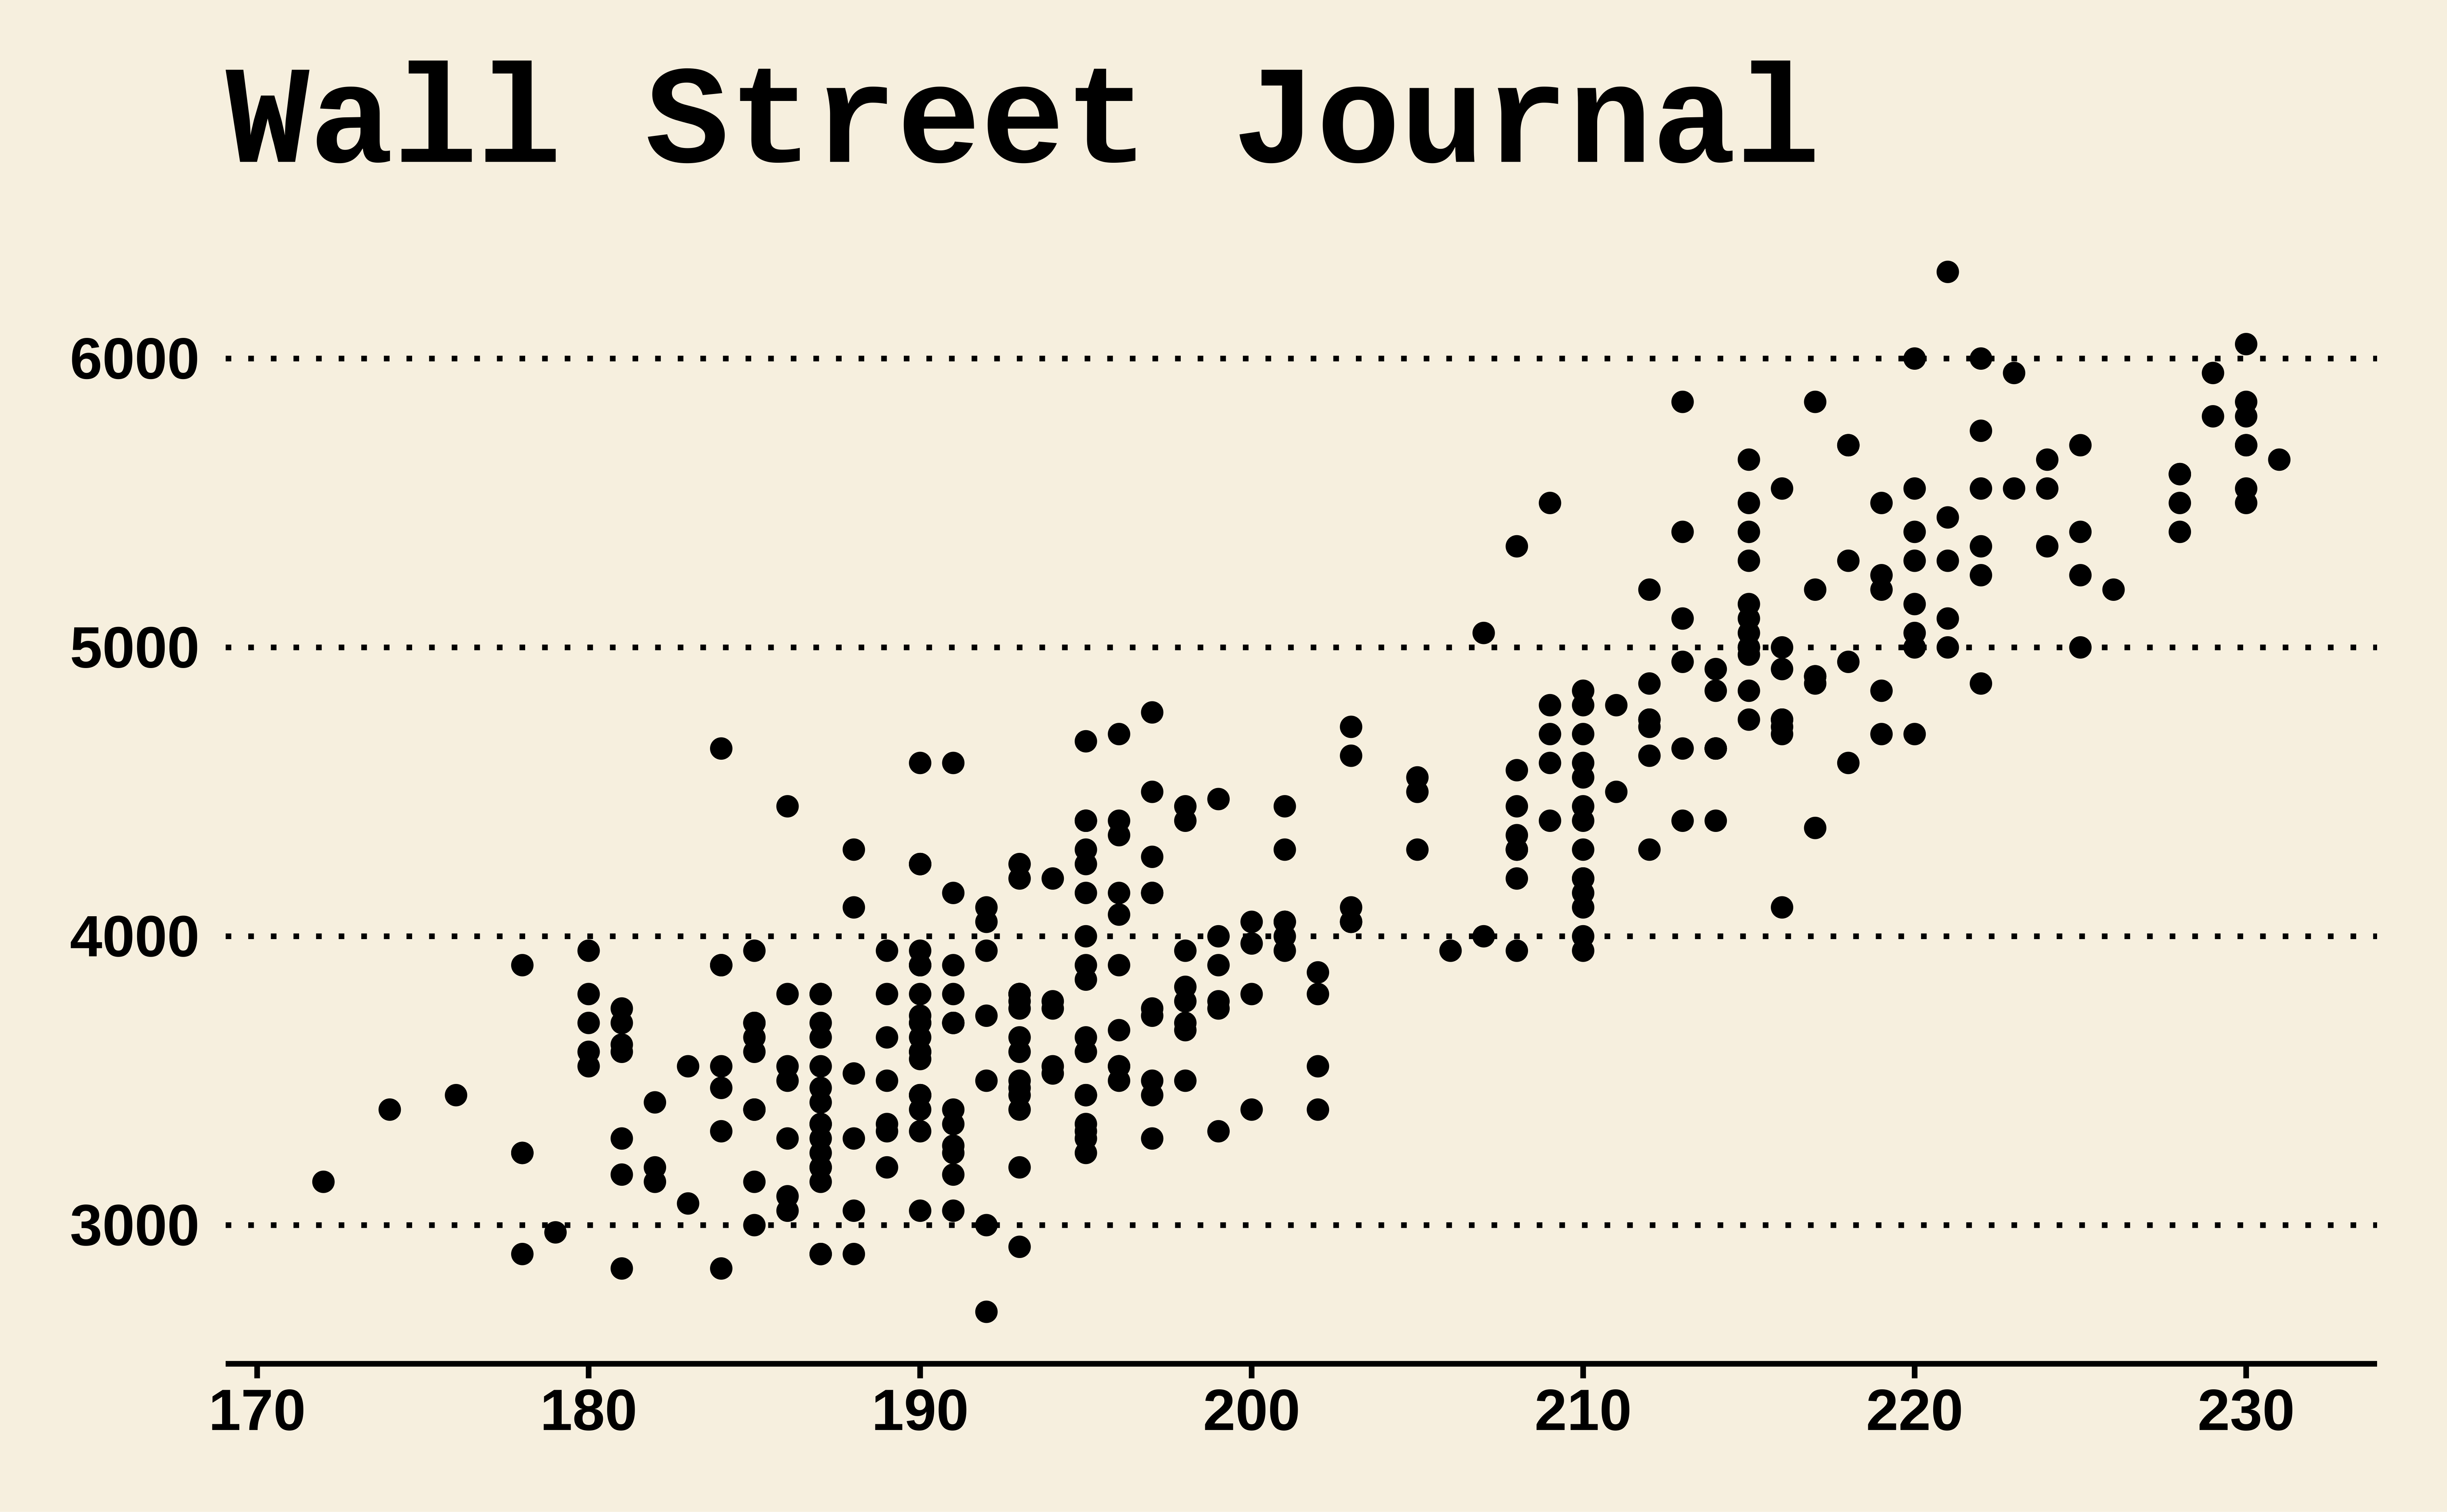
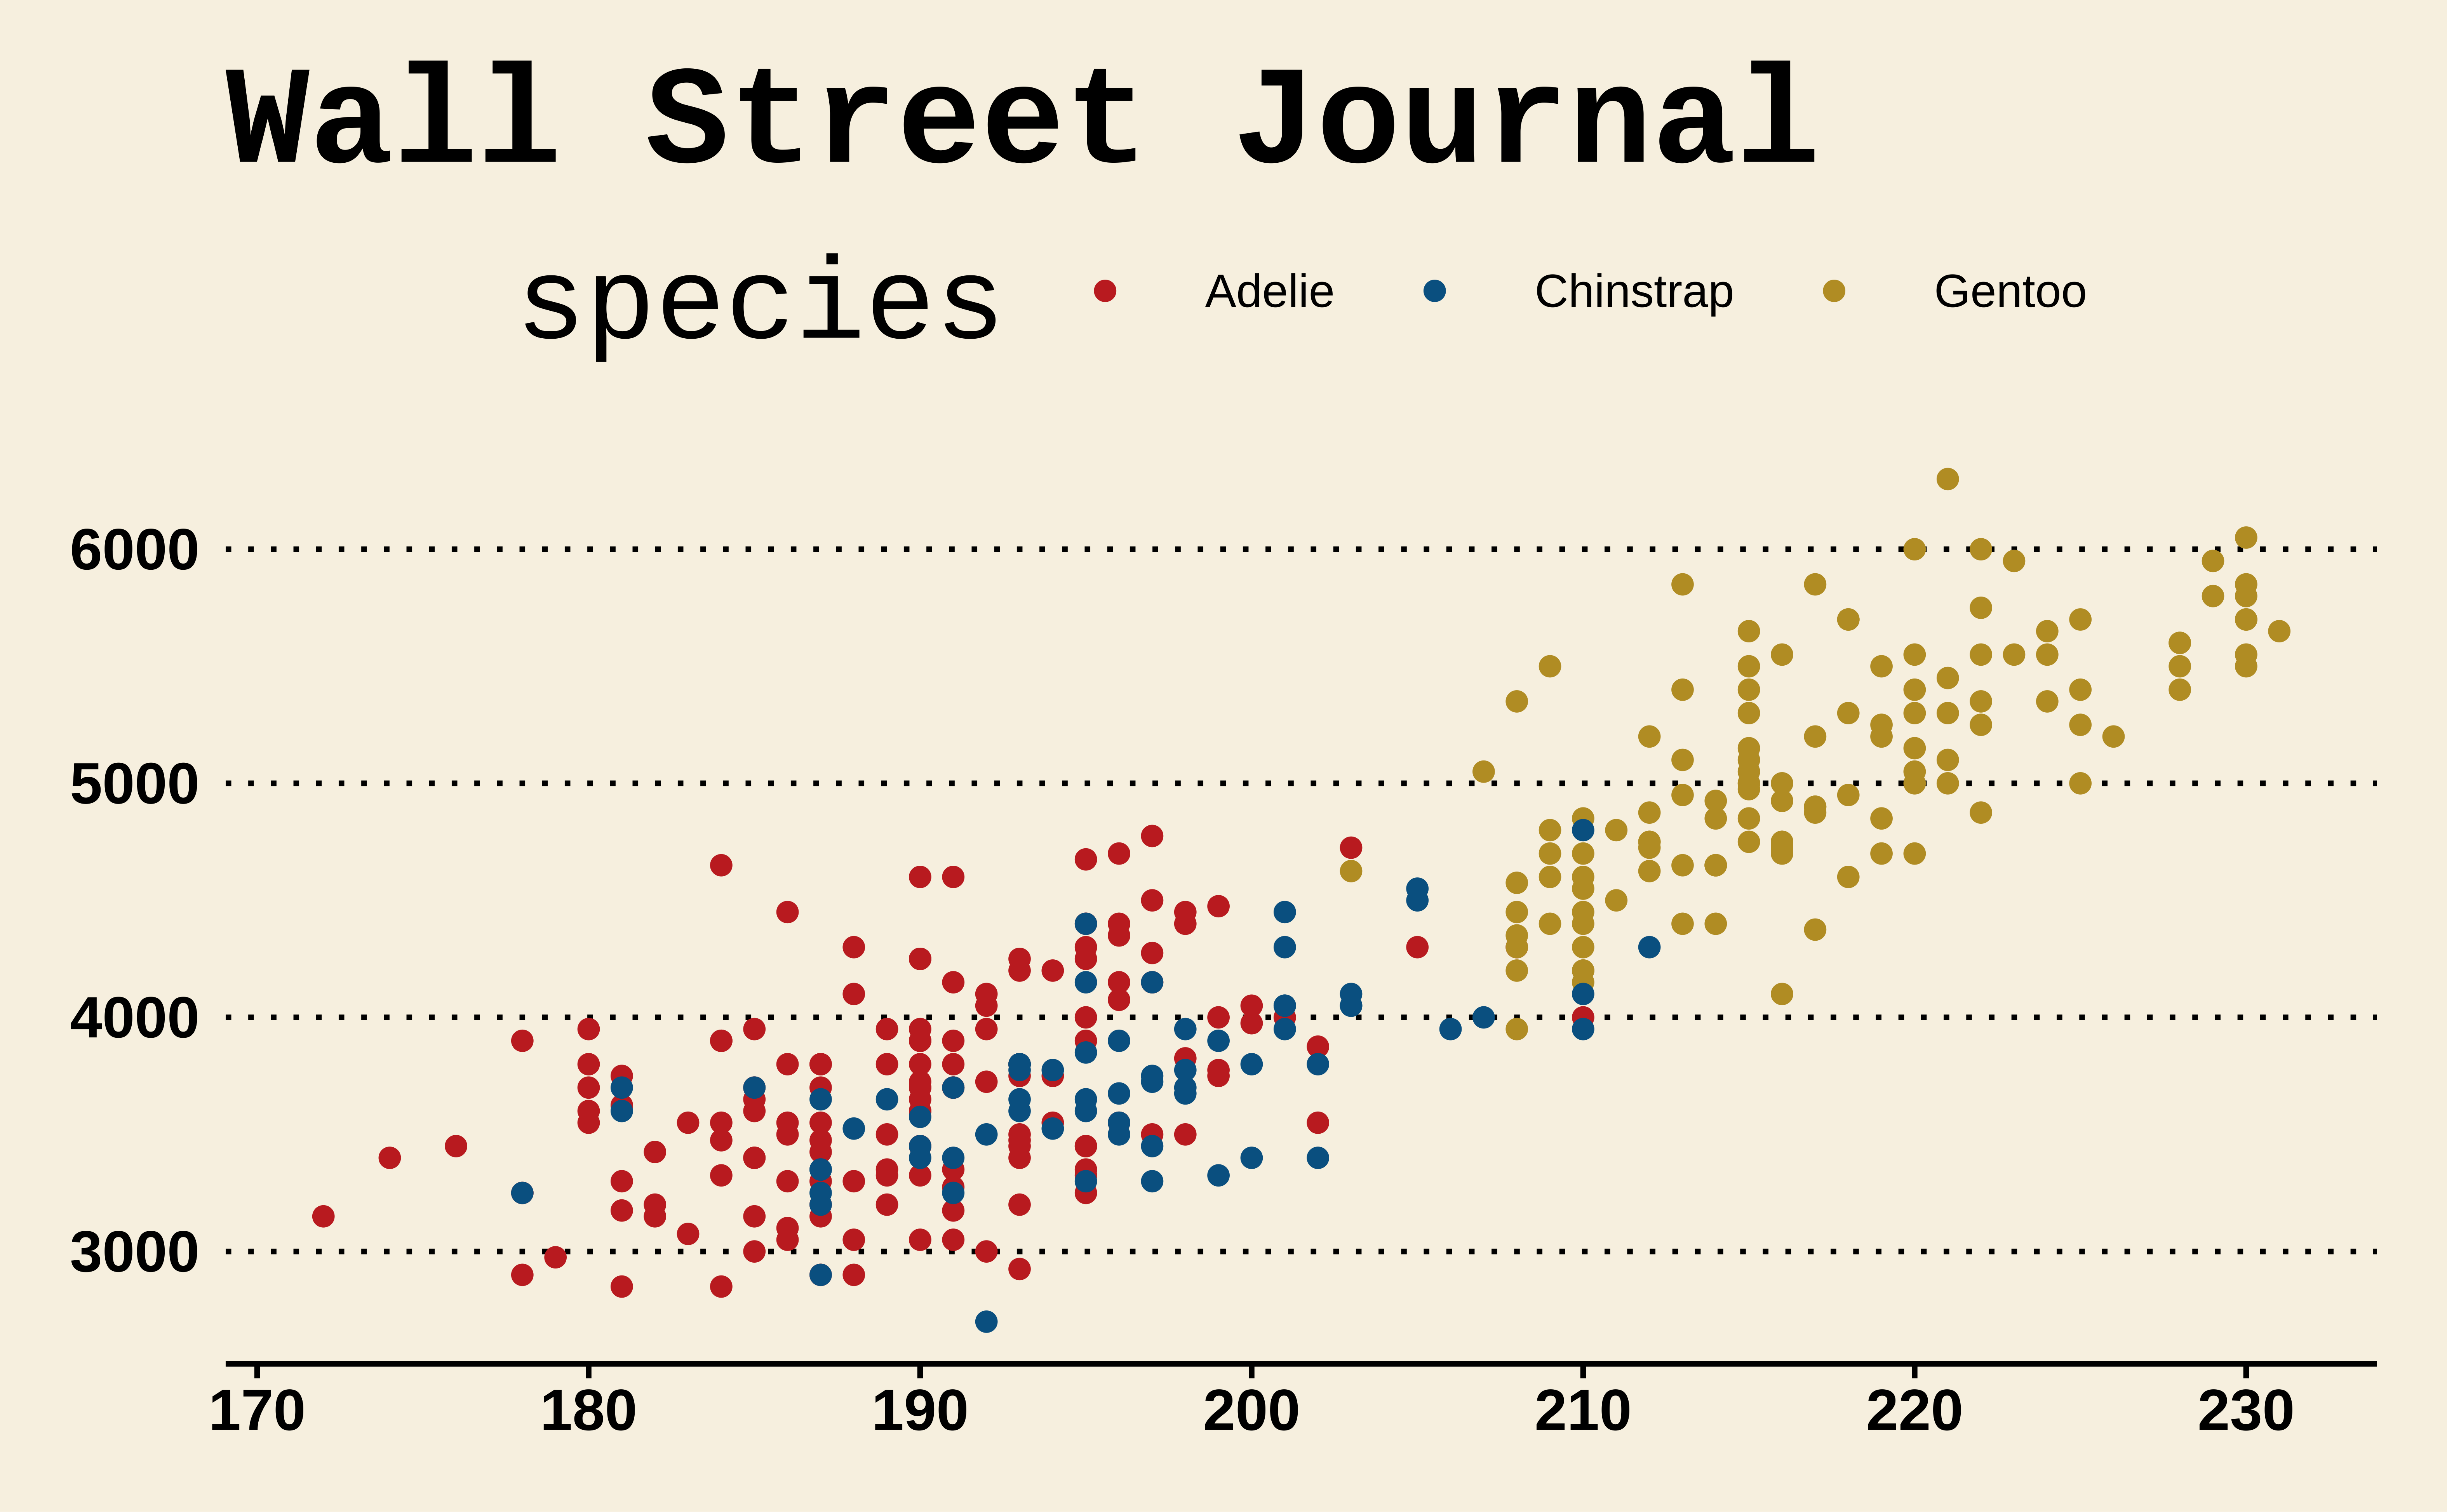
p + theme_wsj() + labs(title = "Wall Street Journal")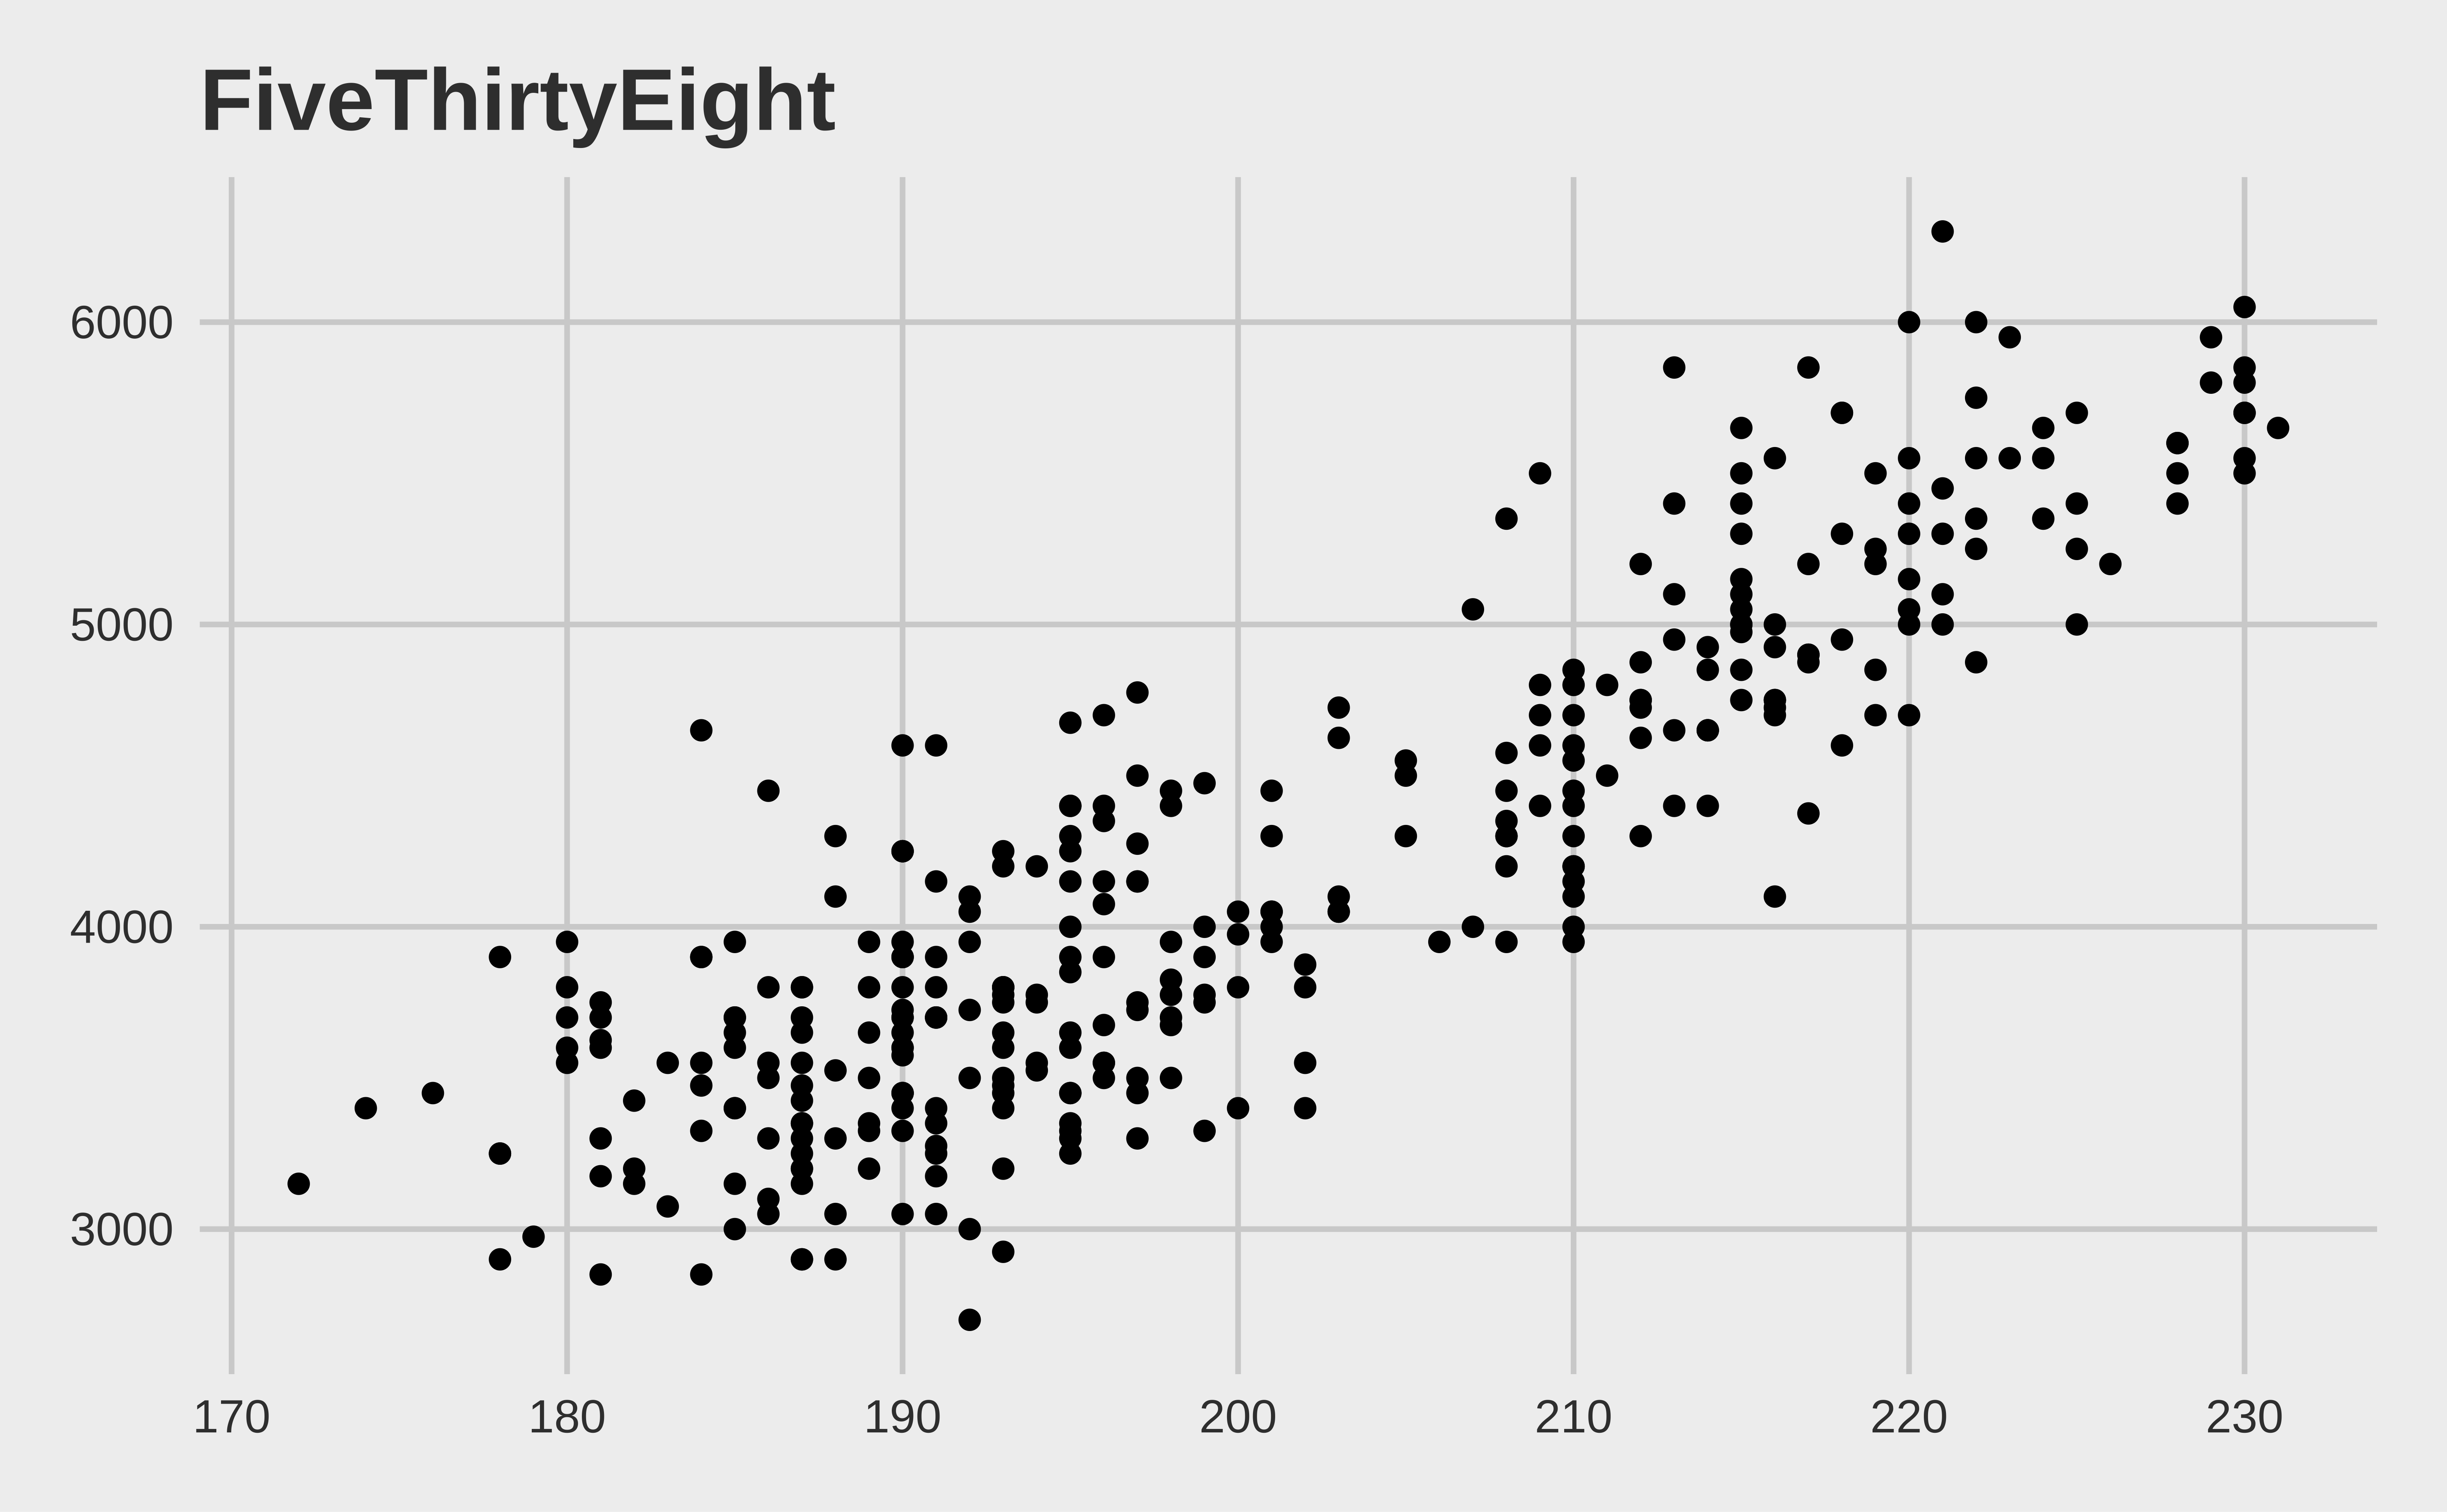
Themes and color scales from ggthemes
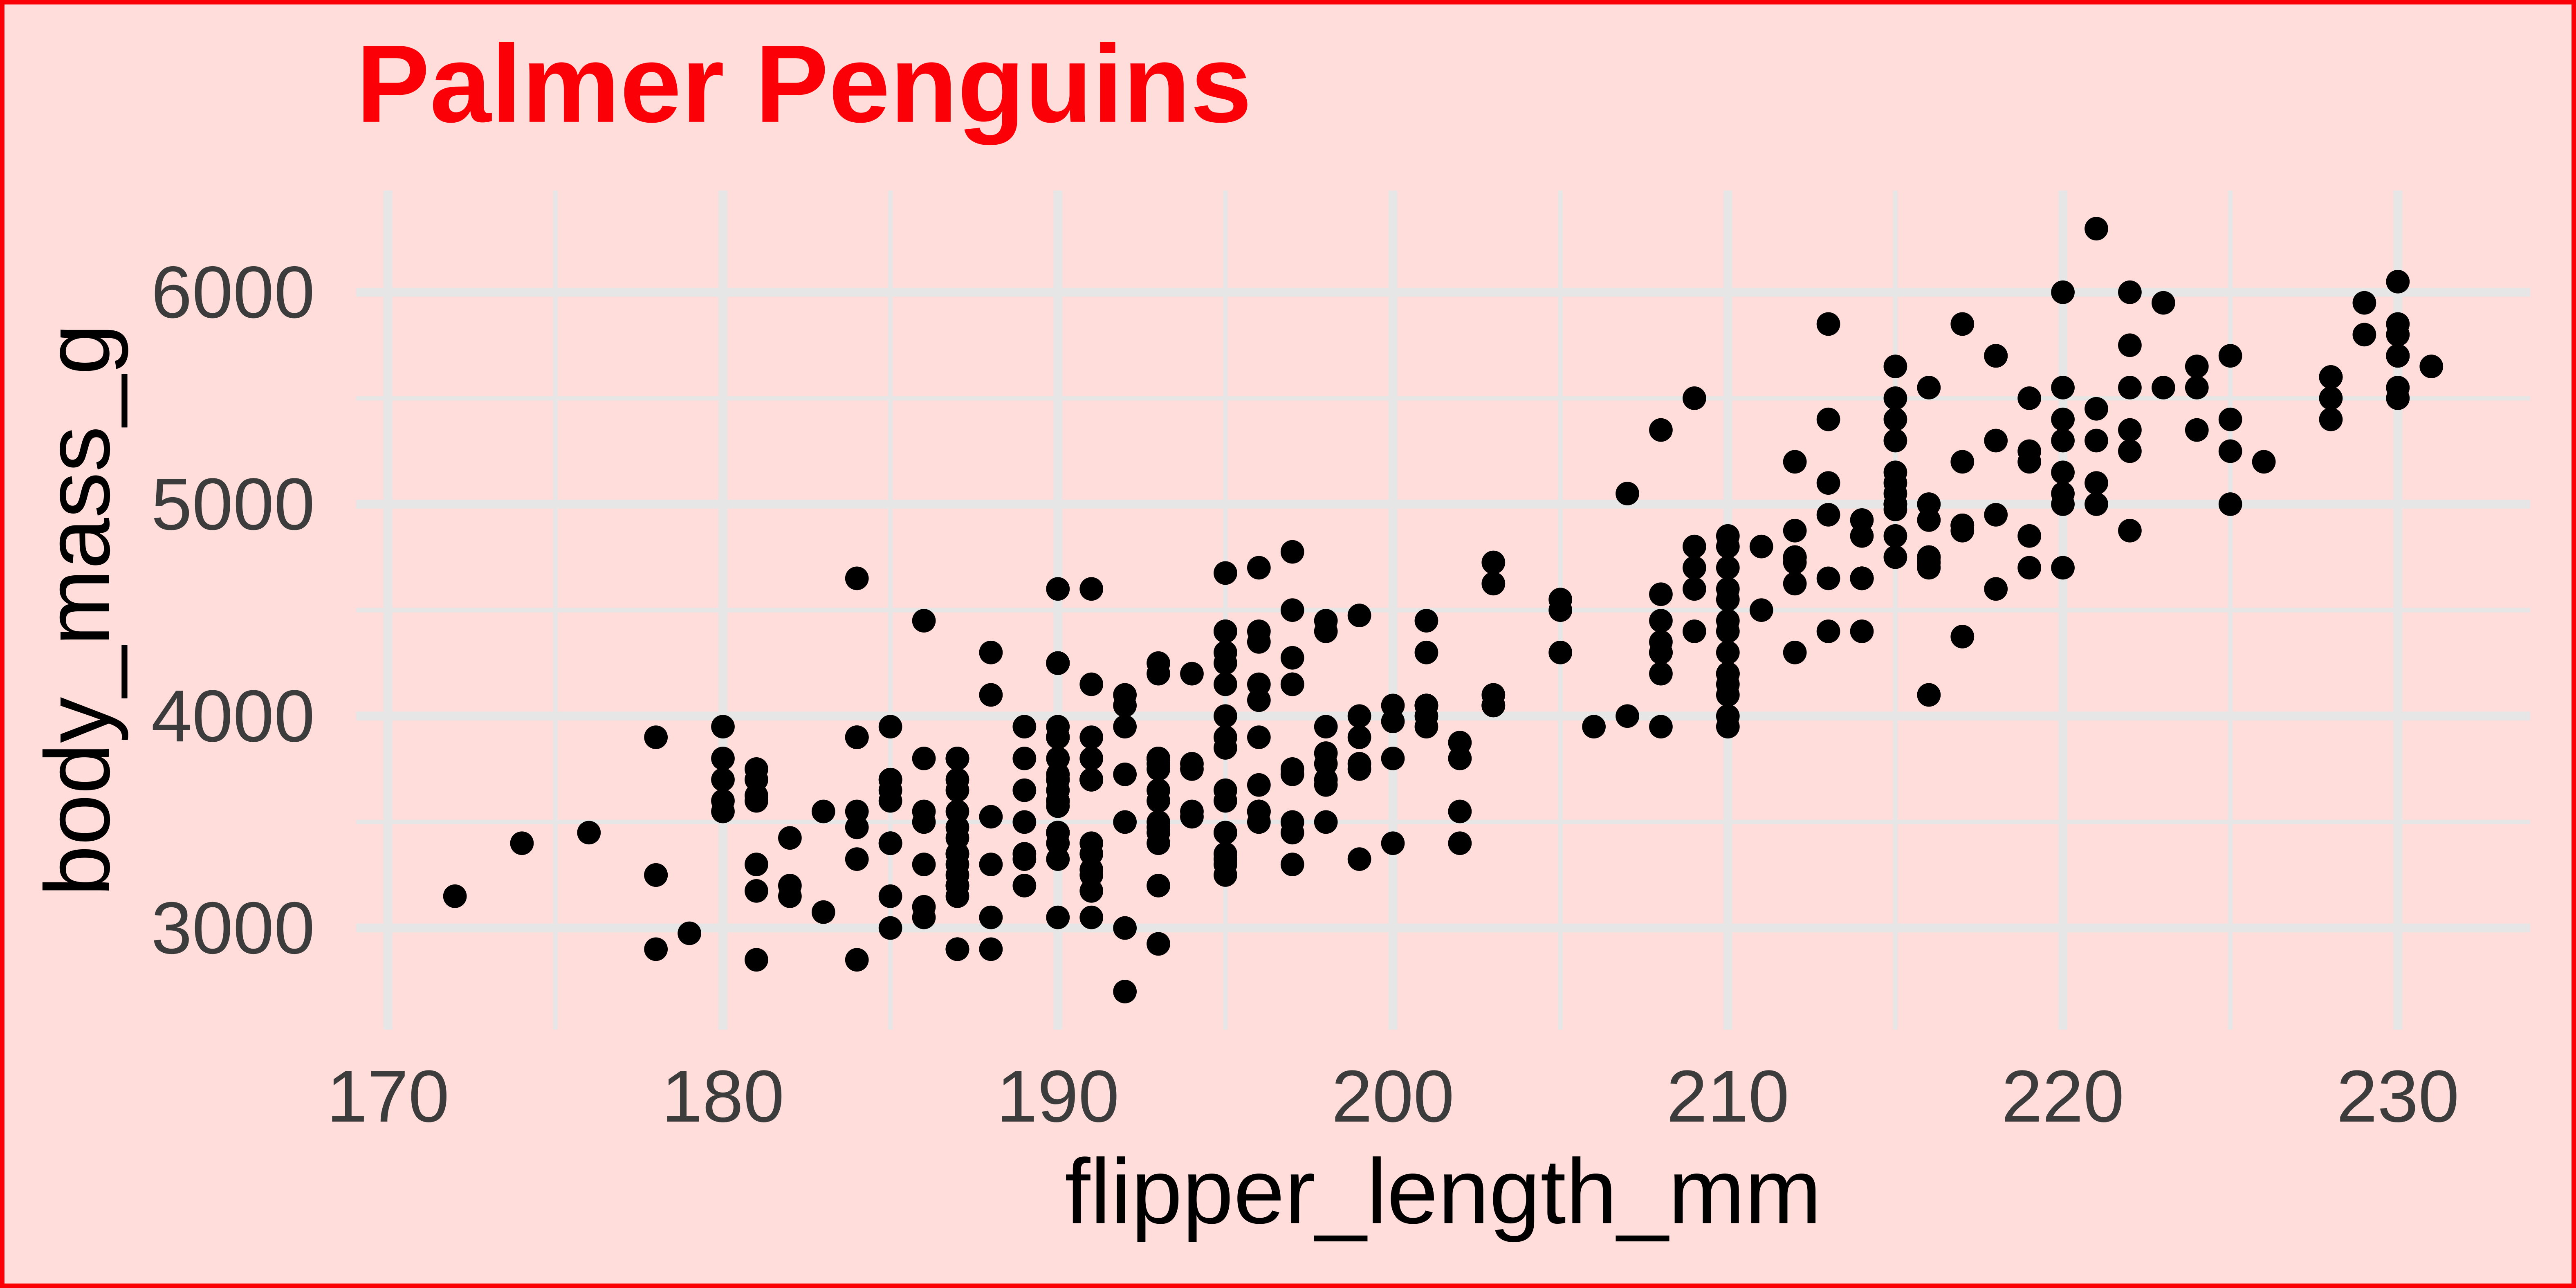
Themes from ThemePark
p +
  geom_point(color = barbie_theme_colors["medium"]) +
  theme_barbie()
p +
  geom_point(color = gameofthrones_theme_colors["medium"]) +
  theme_gameofthrones(gameofthrones_font = TRUE)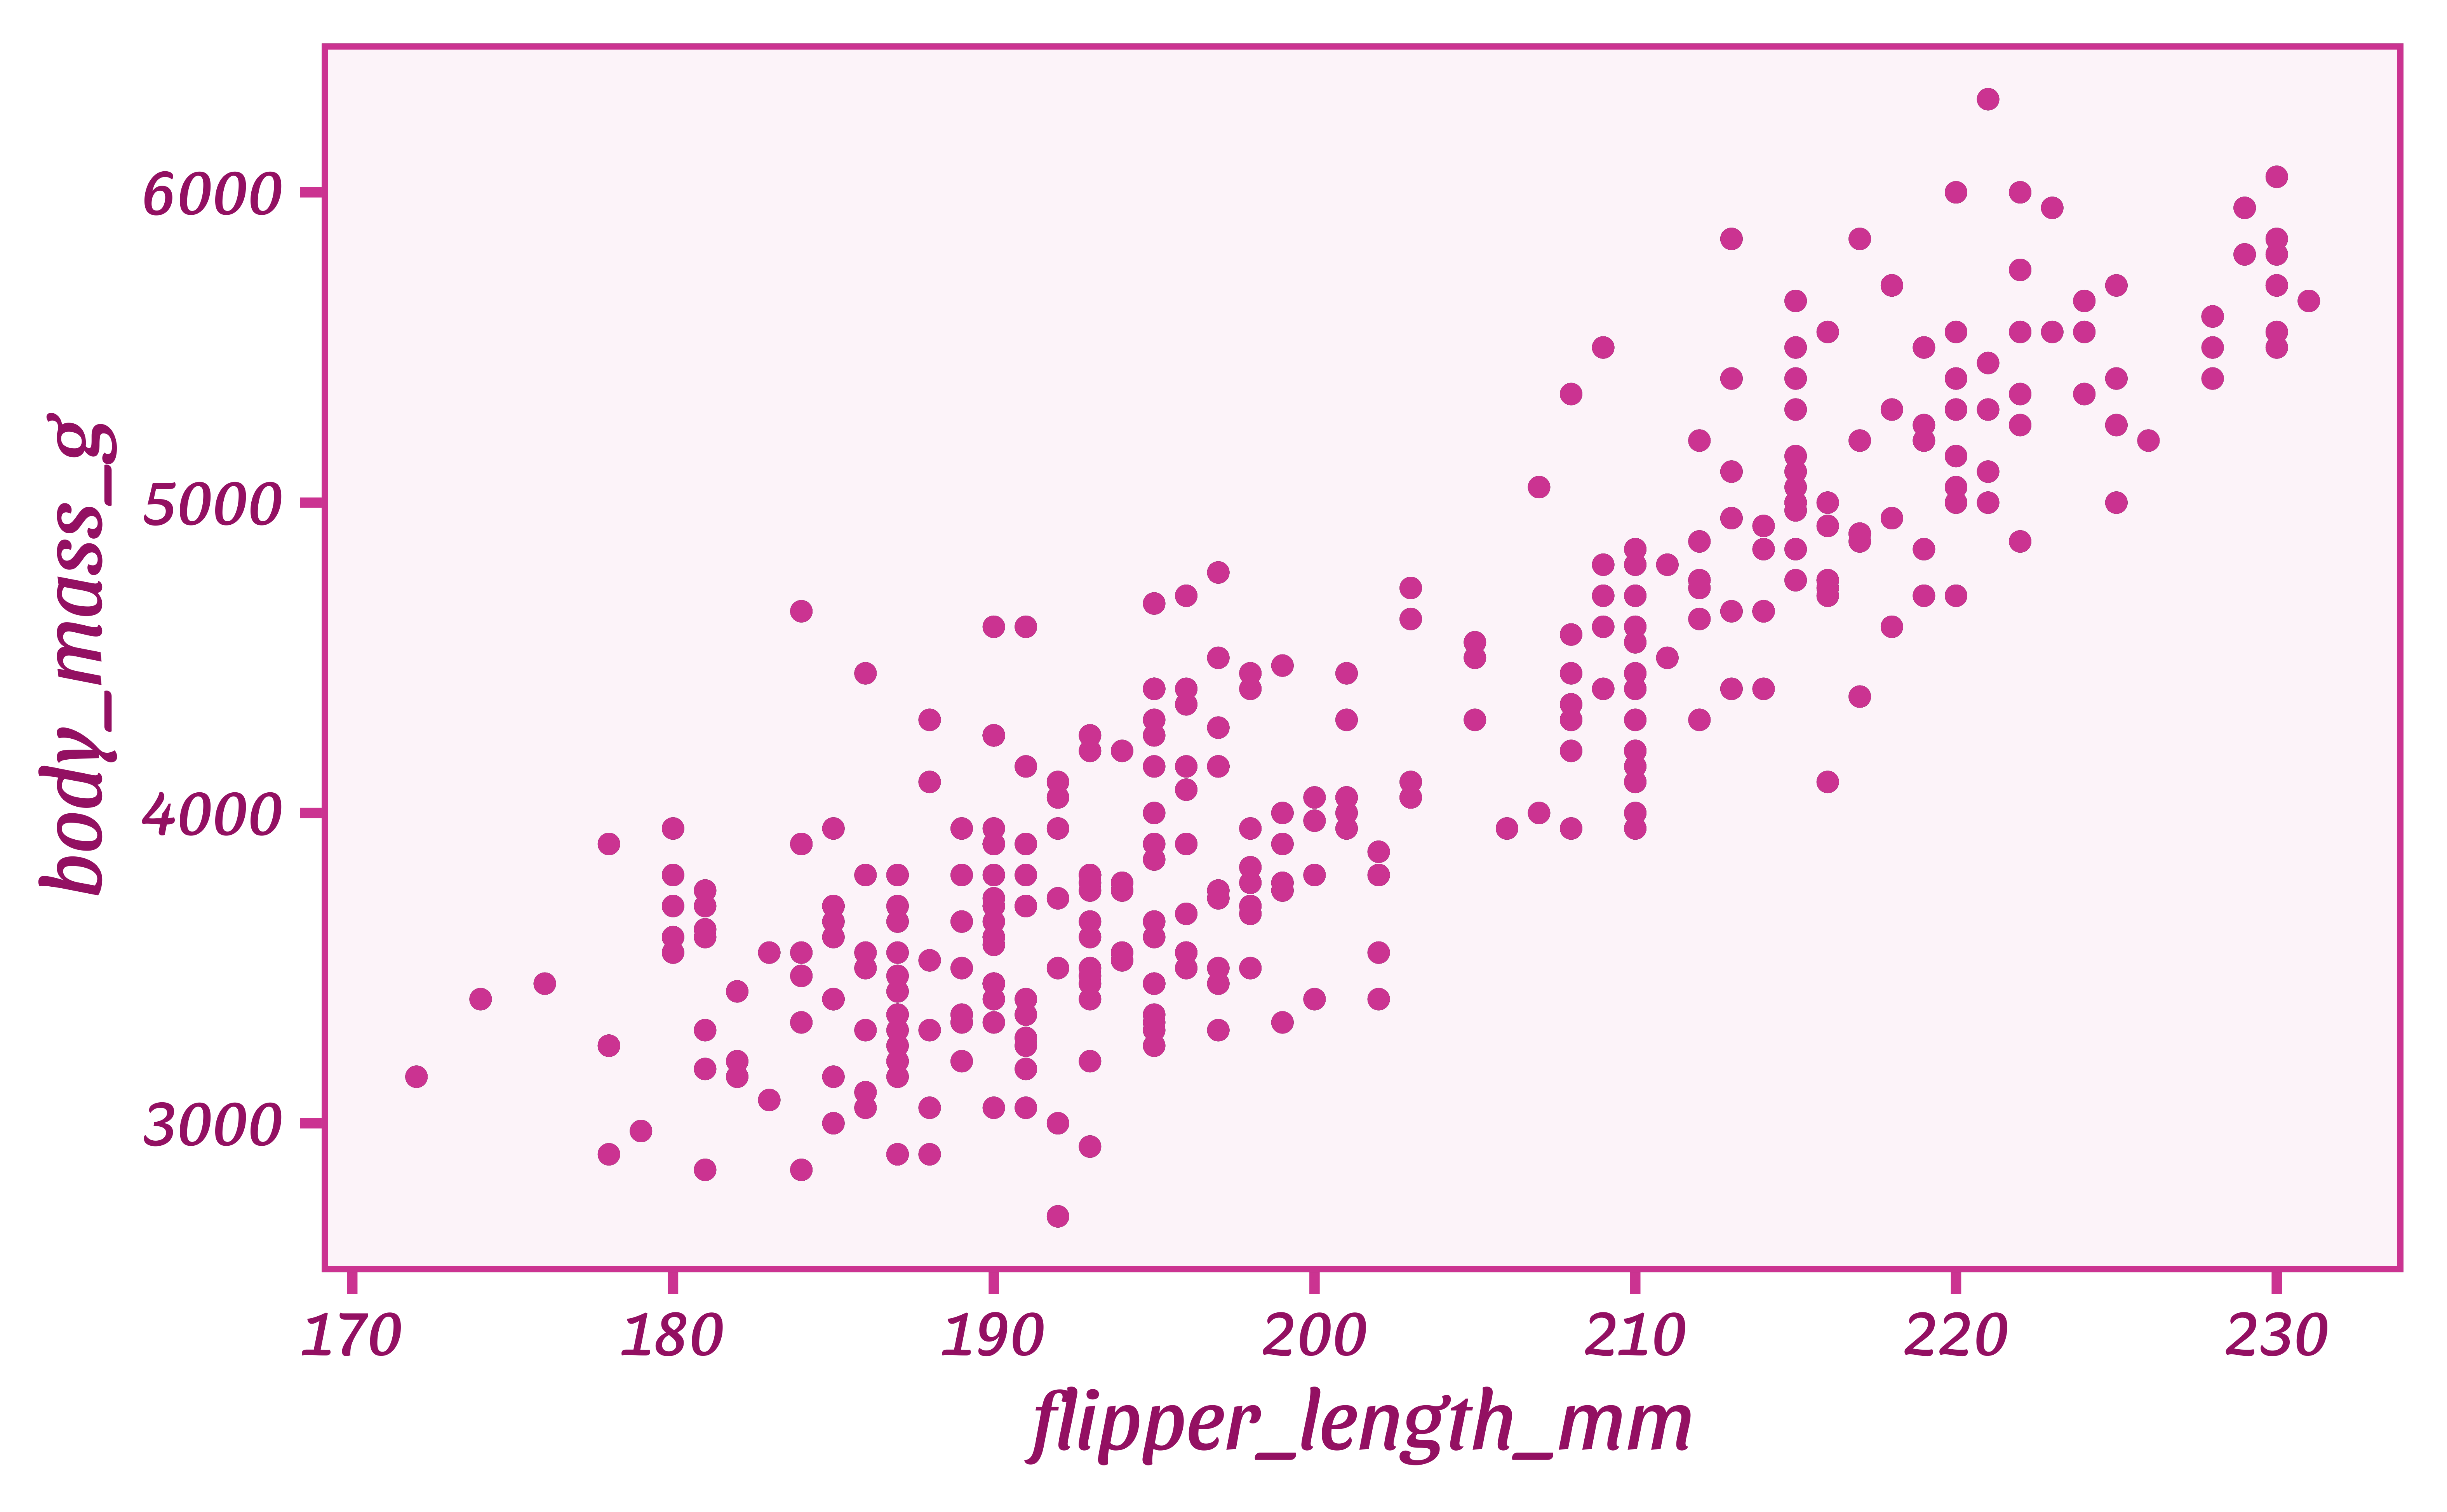
Duke theme!
Warning: Removed 2 rows containing missing values (`geom_point()`).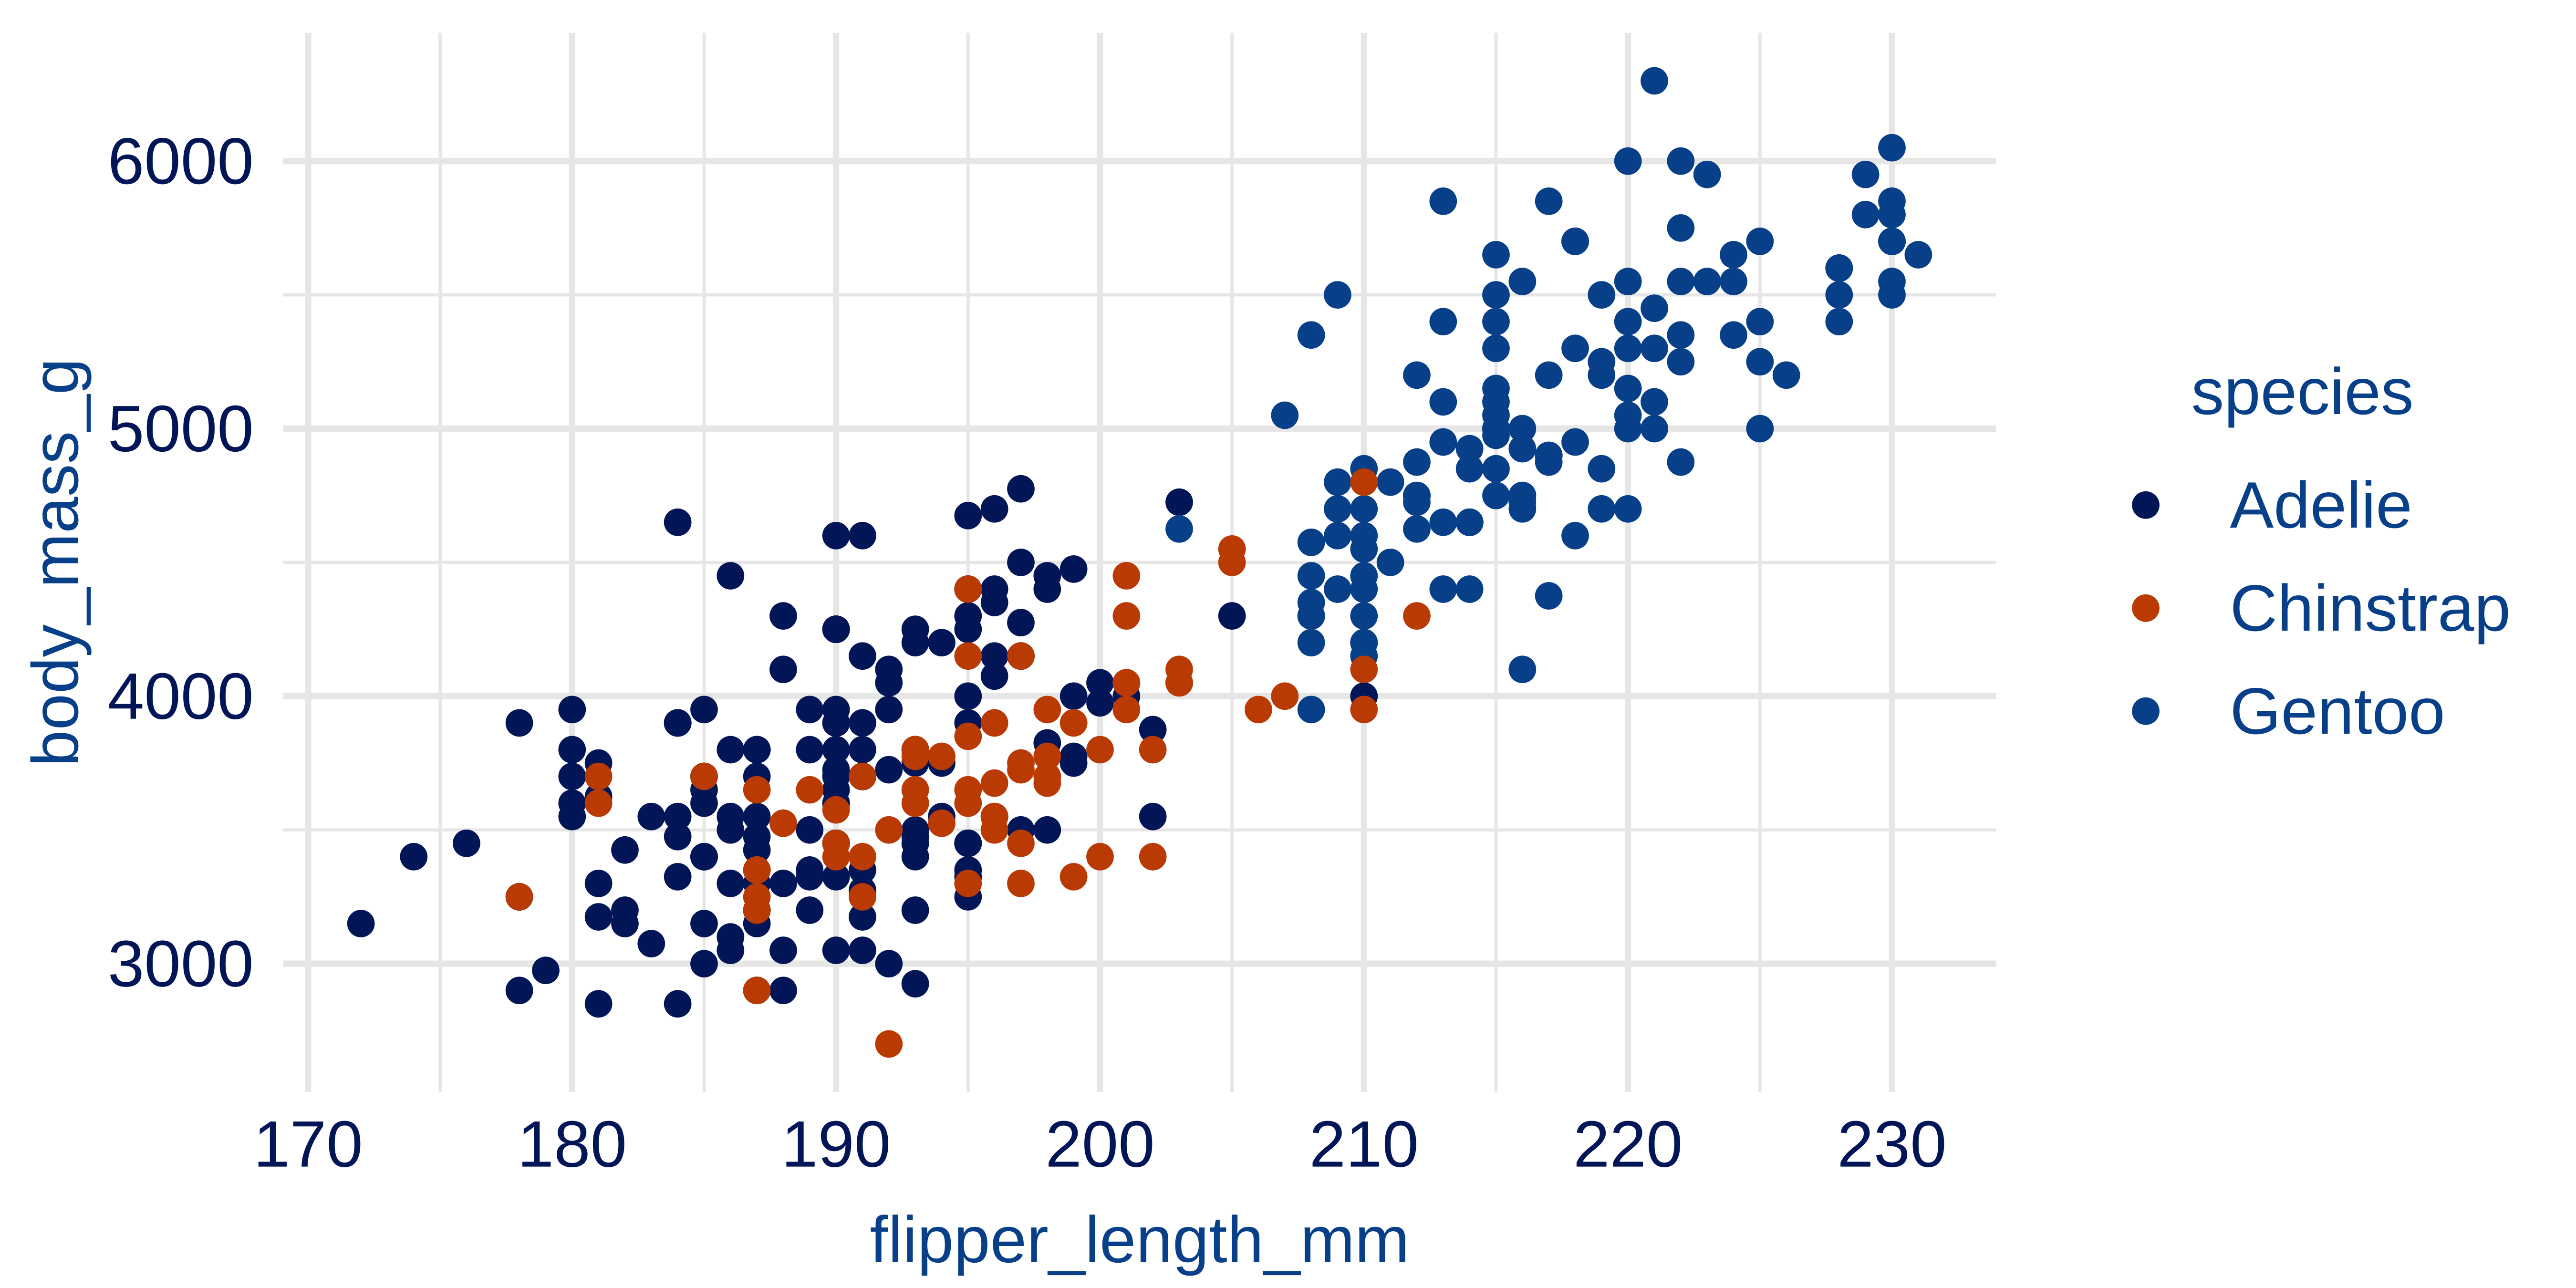
Modifying theme elements
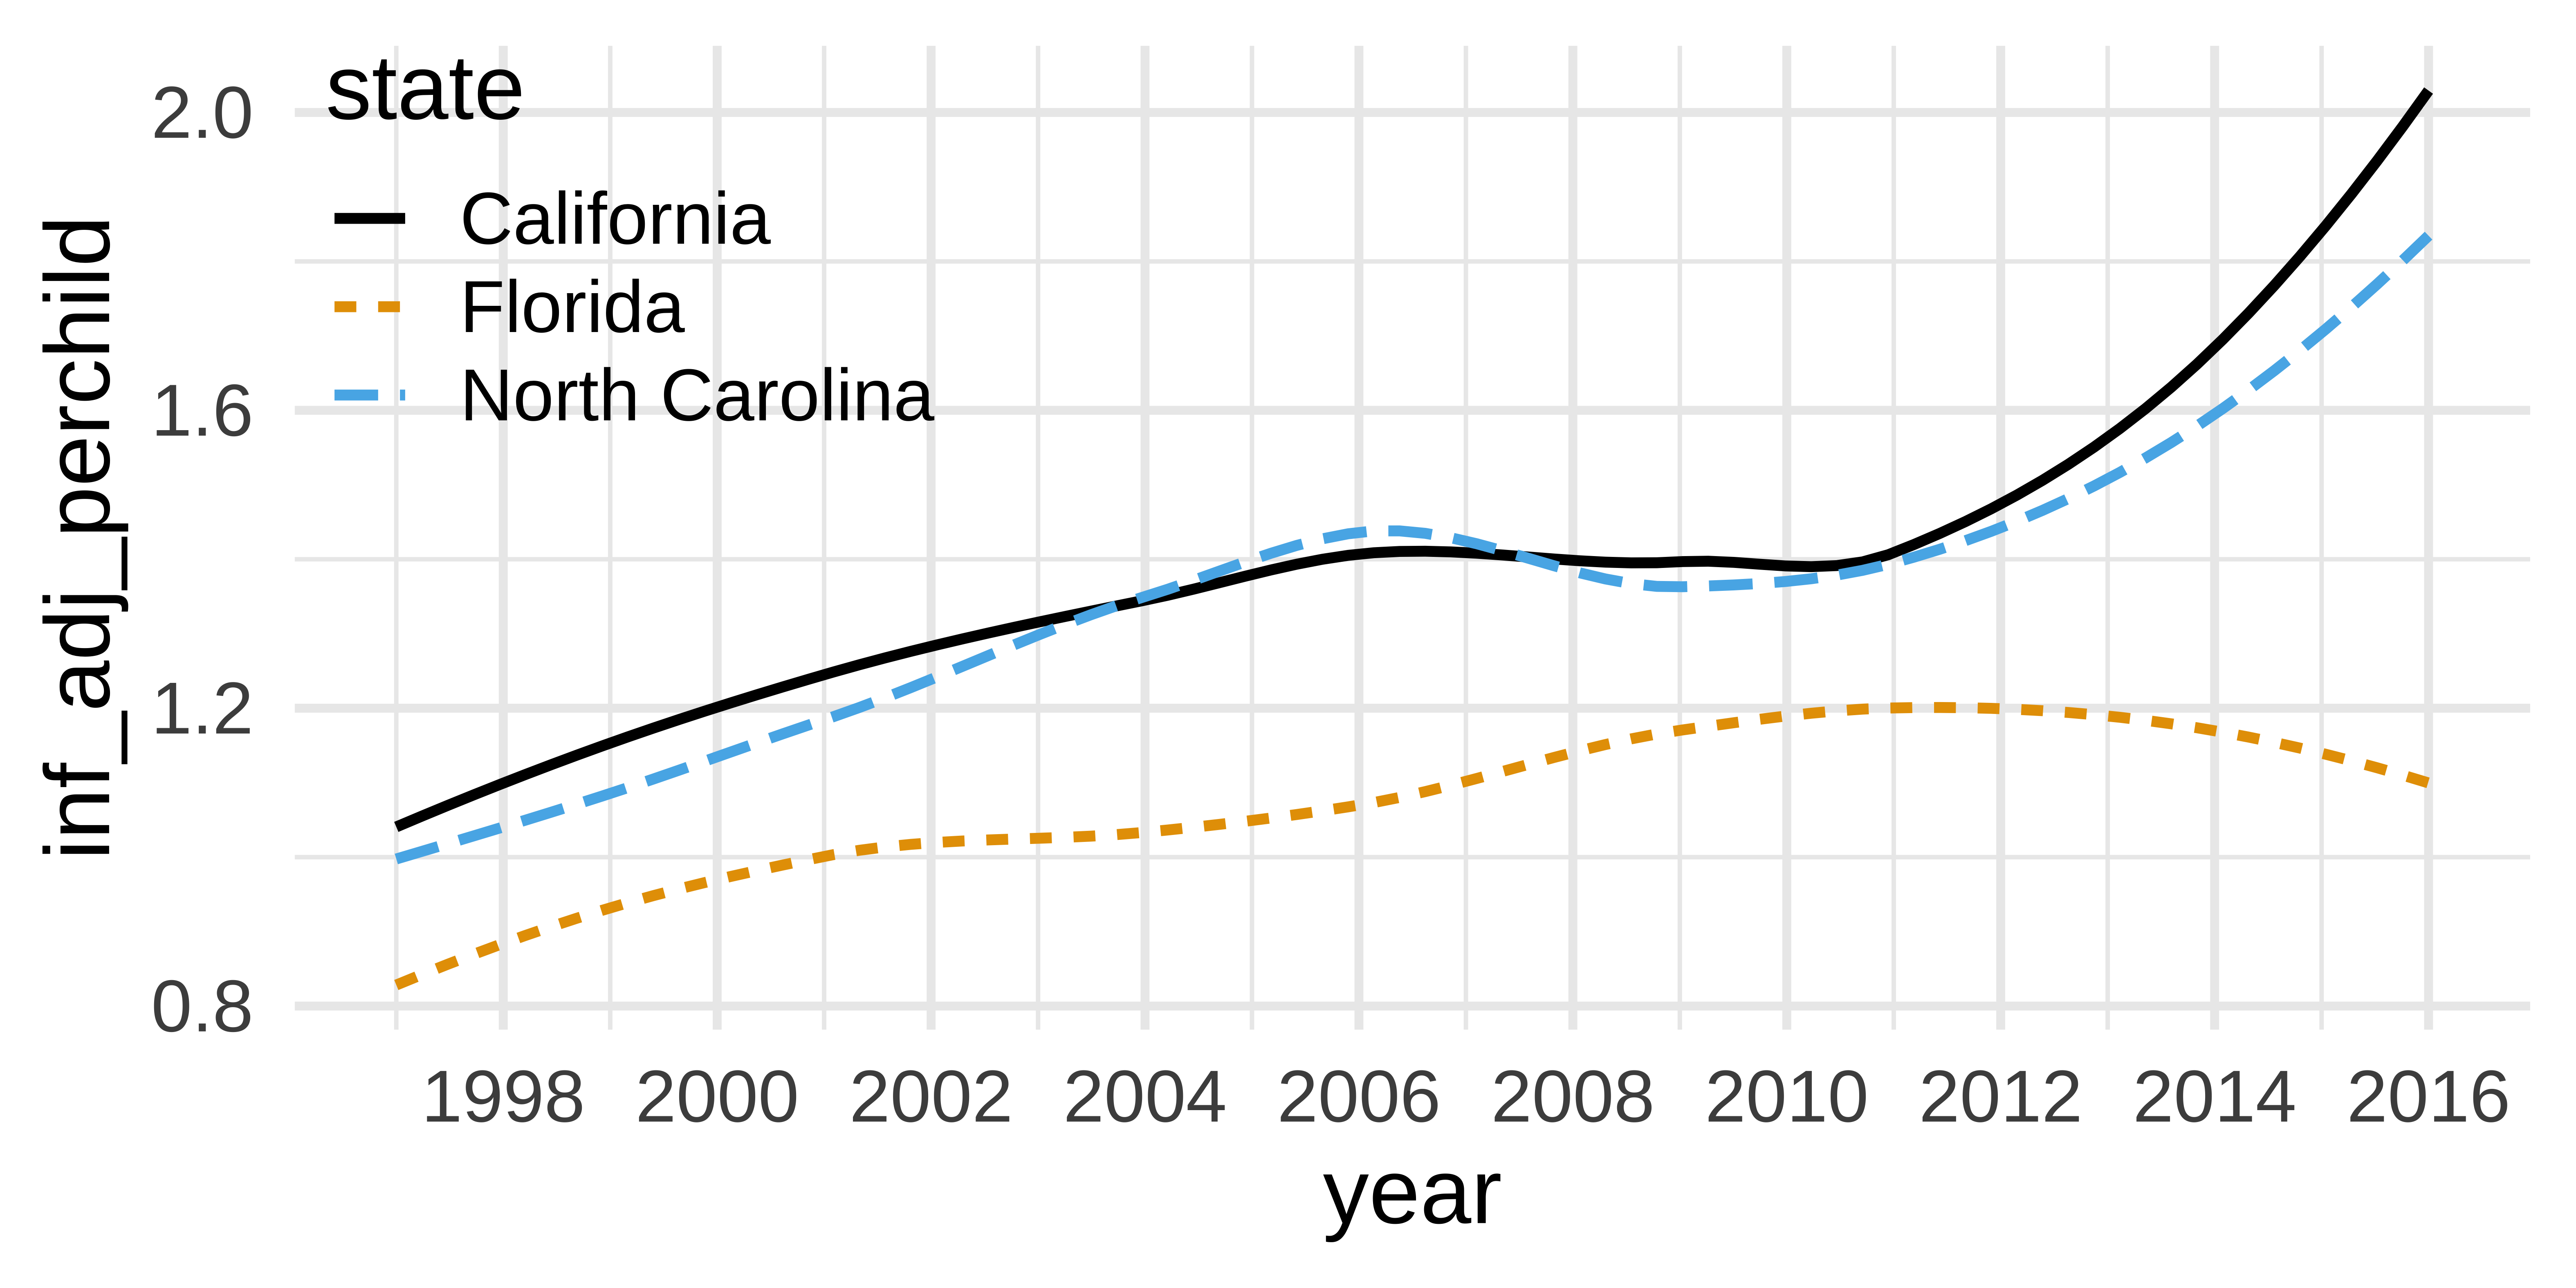
Axis breaks
How can the following figure be improved with custom breaks in axes, if at all?
`geom_smooth()` using method = 'loess' and formula = 'y ~ x'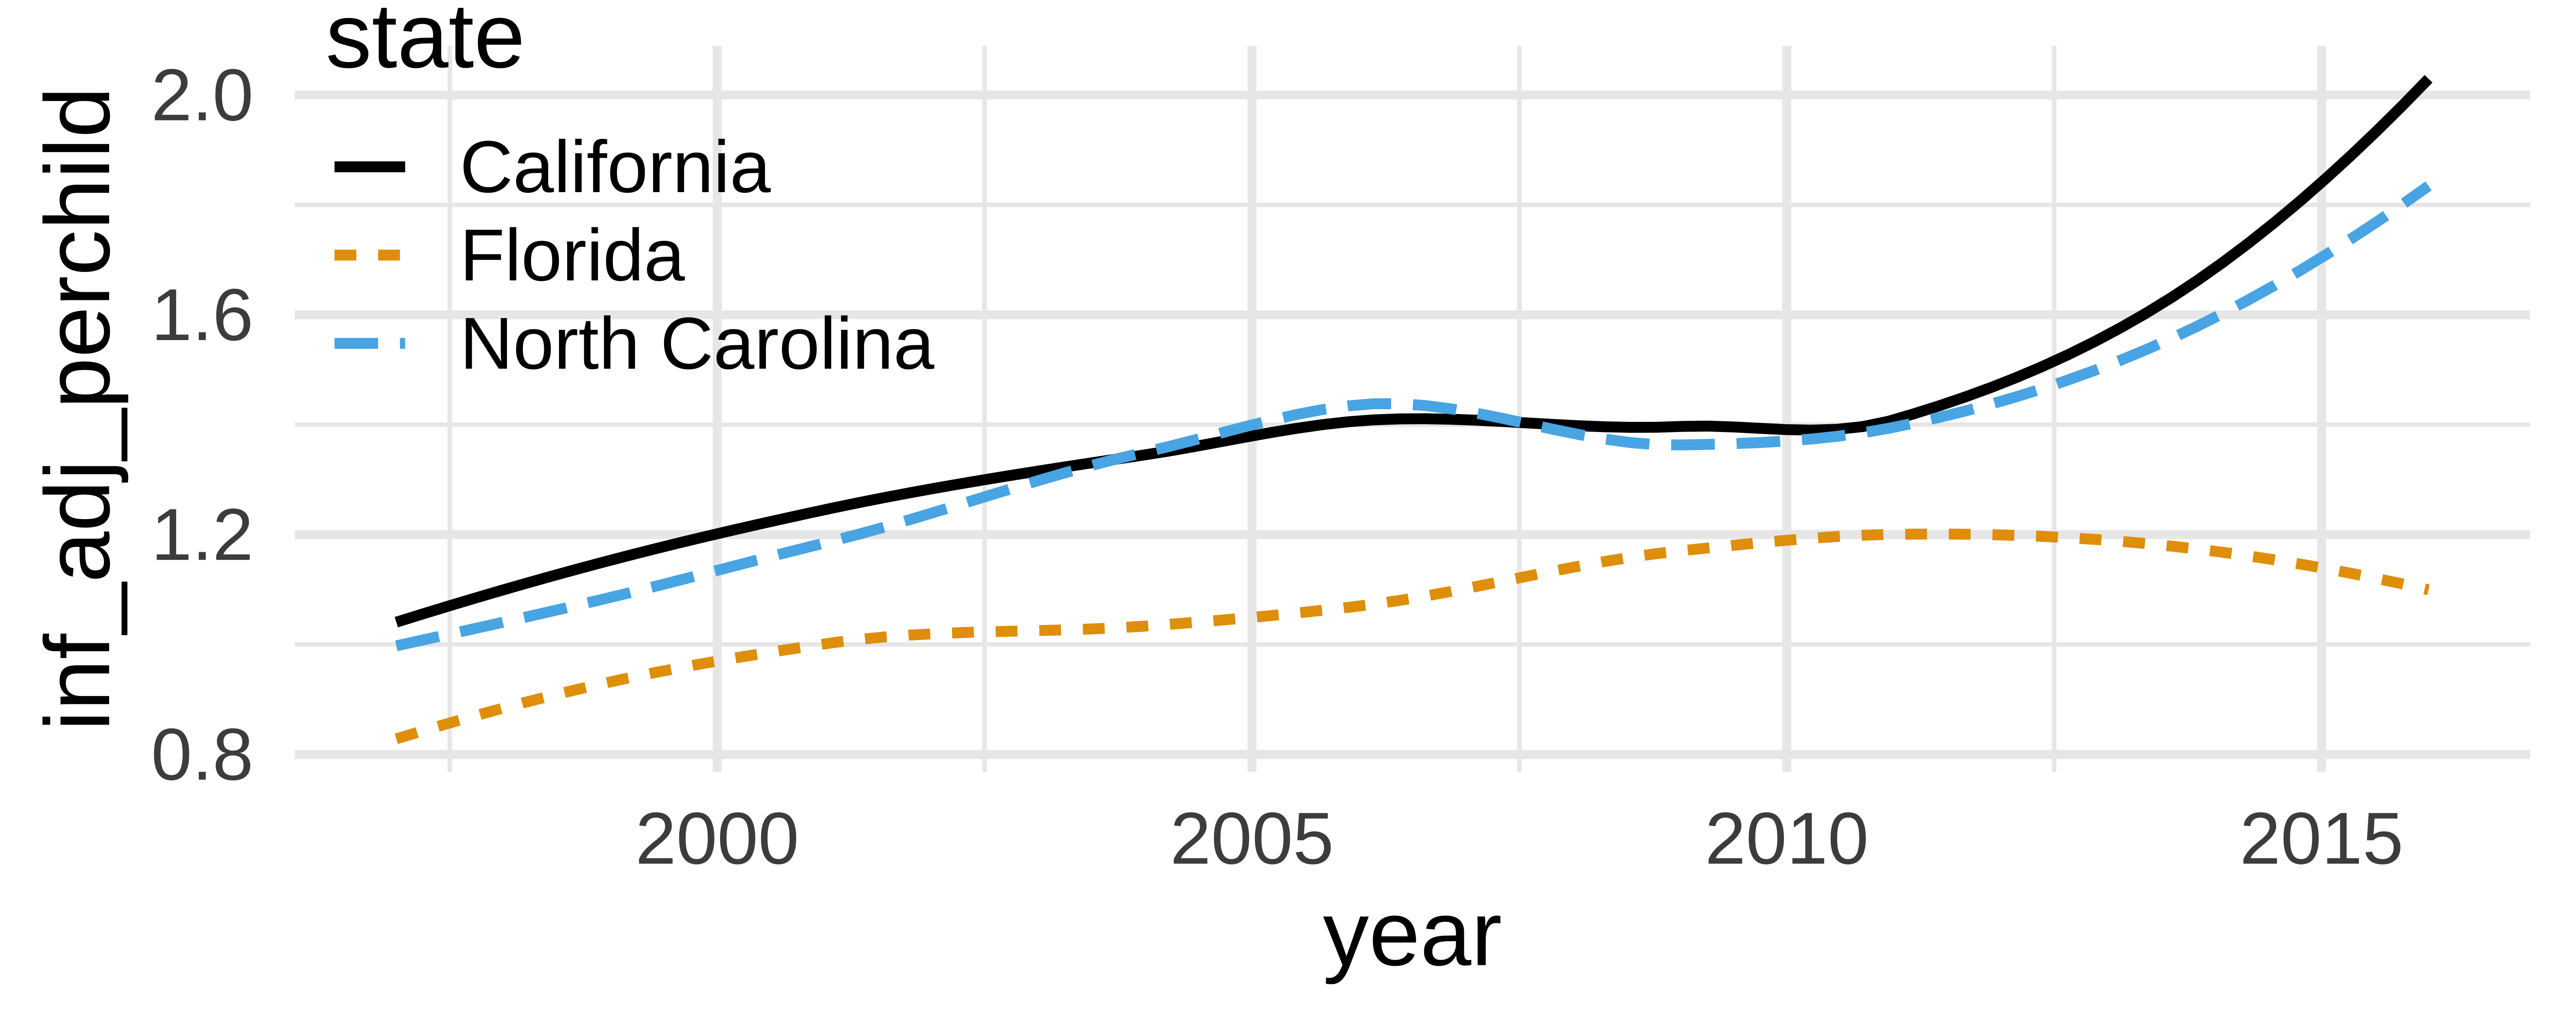
kids_plot <- tidykids |>
mutate(year = as.numeric(year)) |>
filter(
state %in% c("North Carolina", "California", "Florida"),
variable == "pubhealth"
) |>
ggplot(aes(x = year, y = inf_adj_perchild, color = state, linetype = state)) +
geom_smooth(se = FALSE) +
scale_color_colorblind() +
theme(legend.position = c(0.15, 0.8))
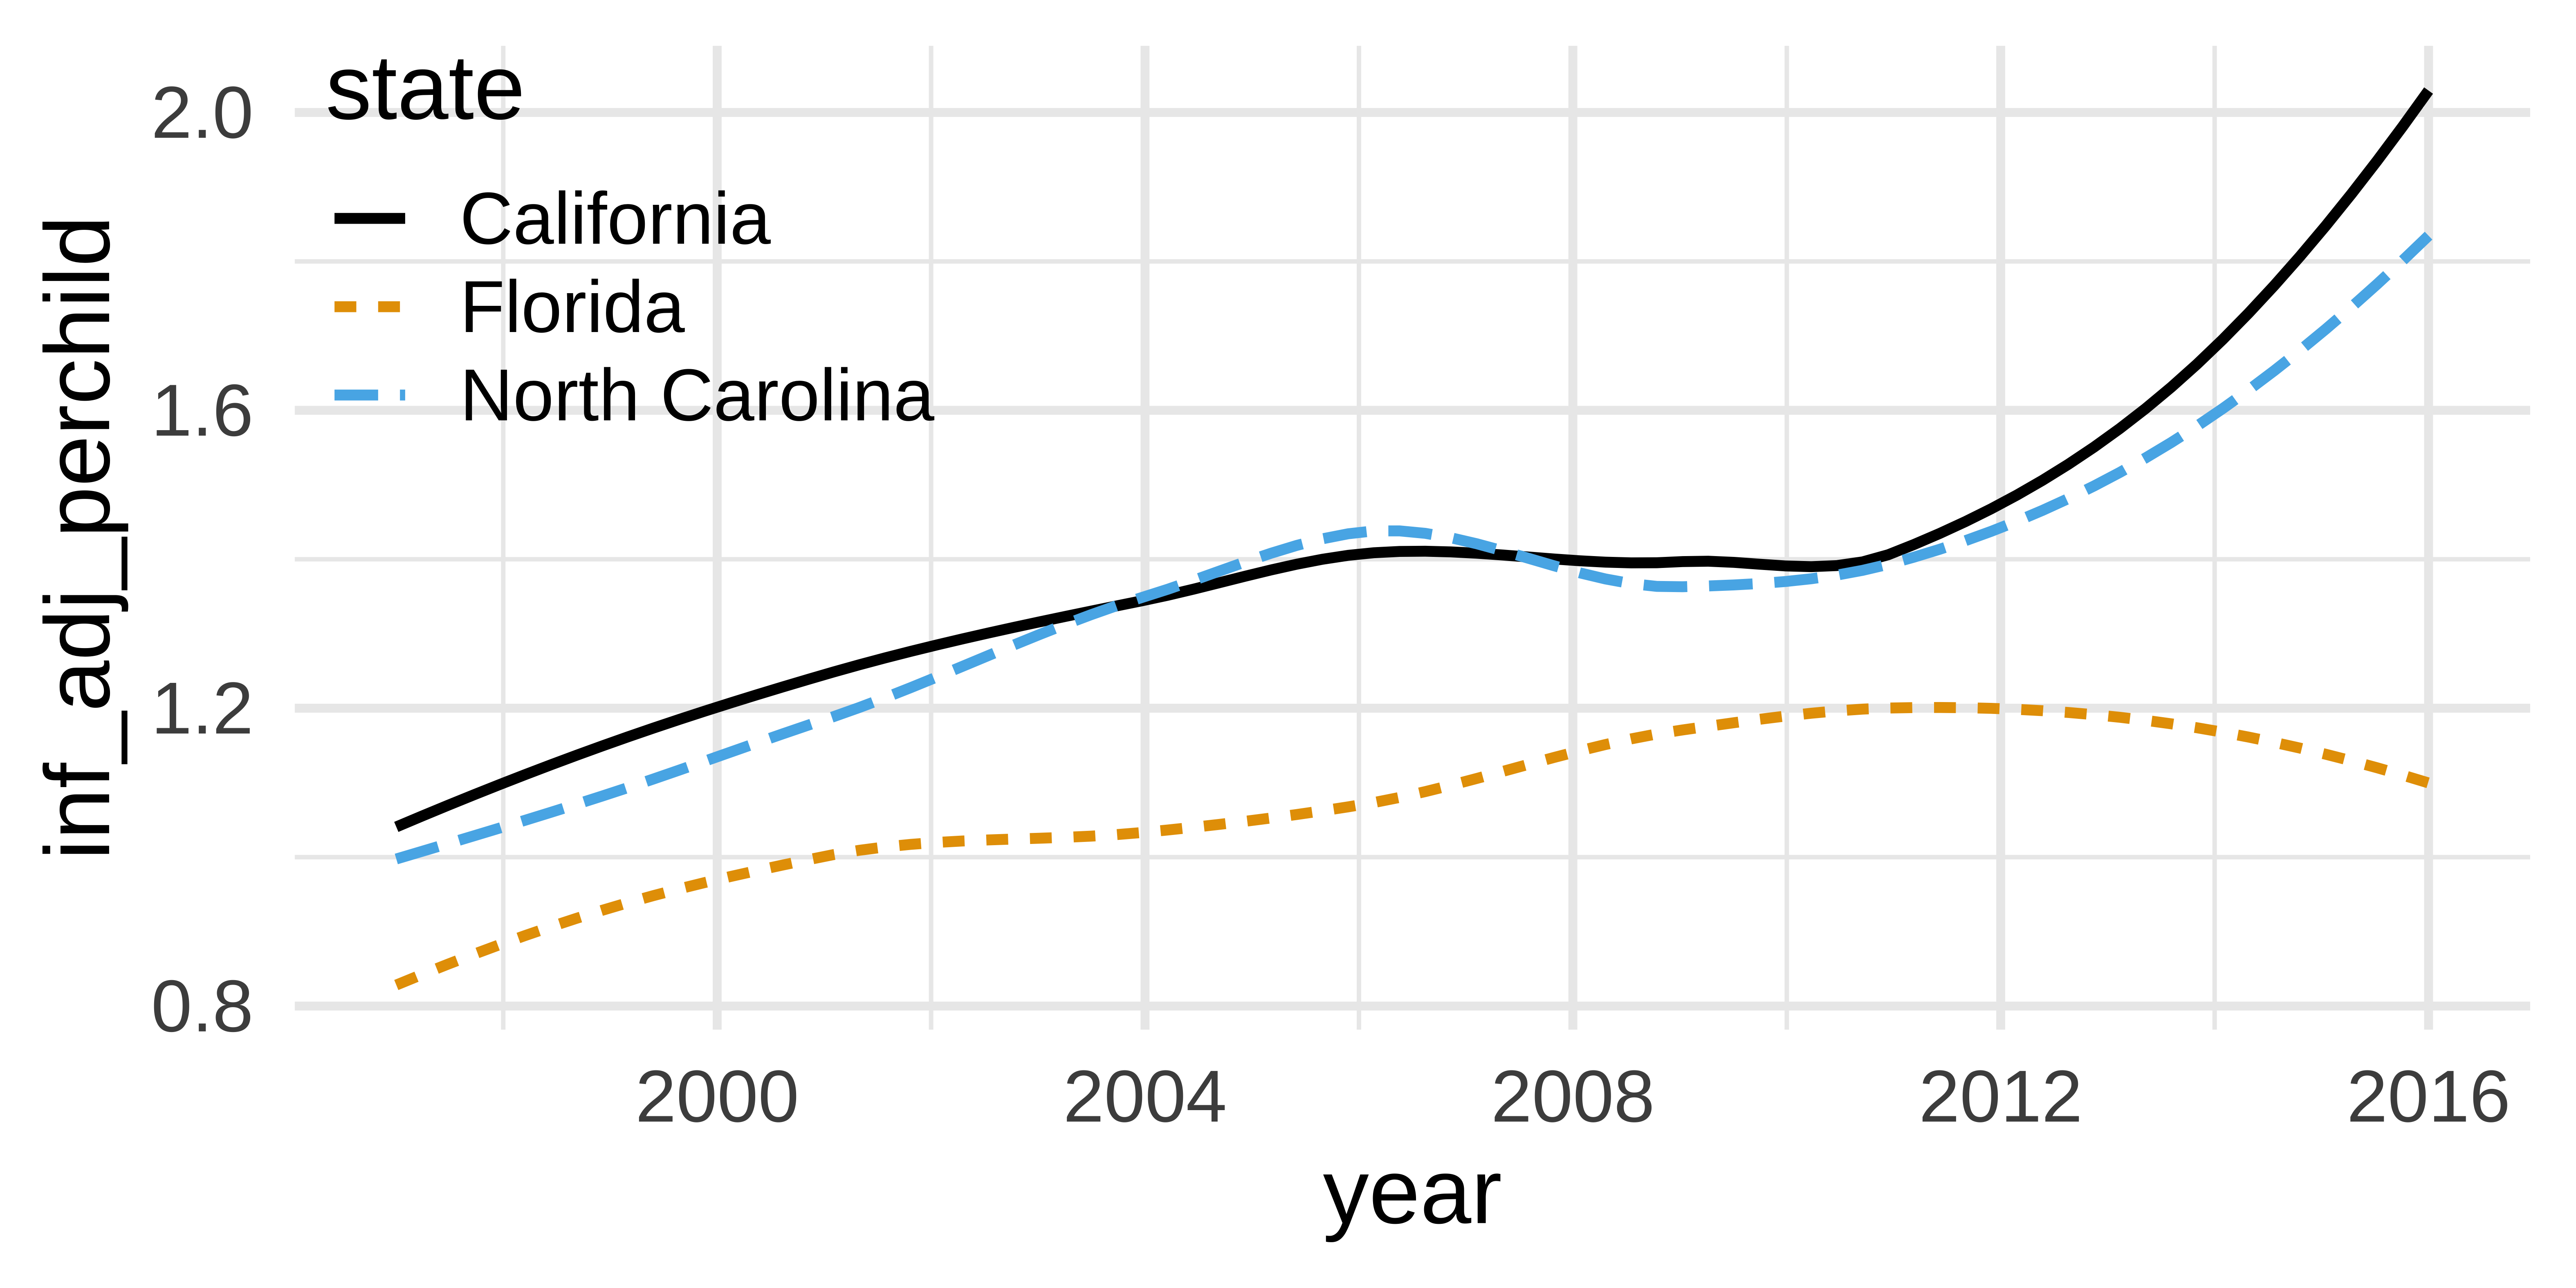
kids_plot`geom_smooth()` using method = 'loess' and formula = 'y ~ x'Context matters
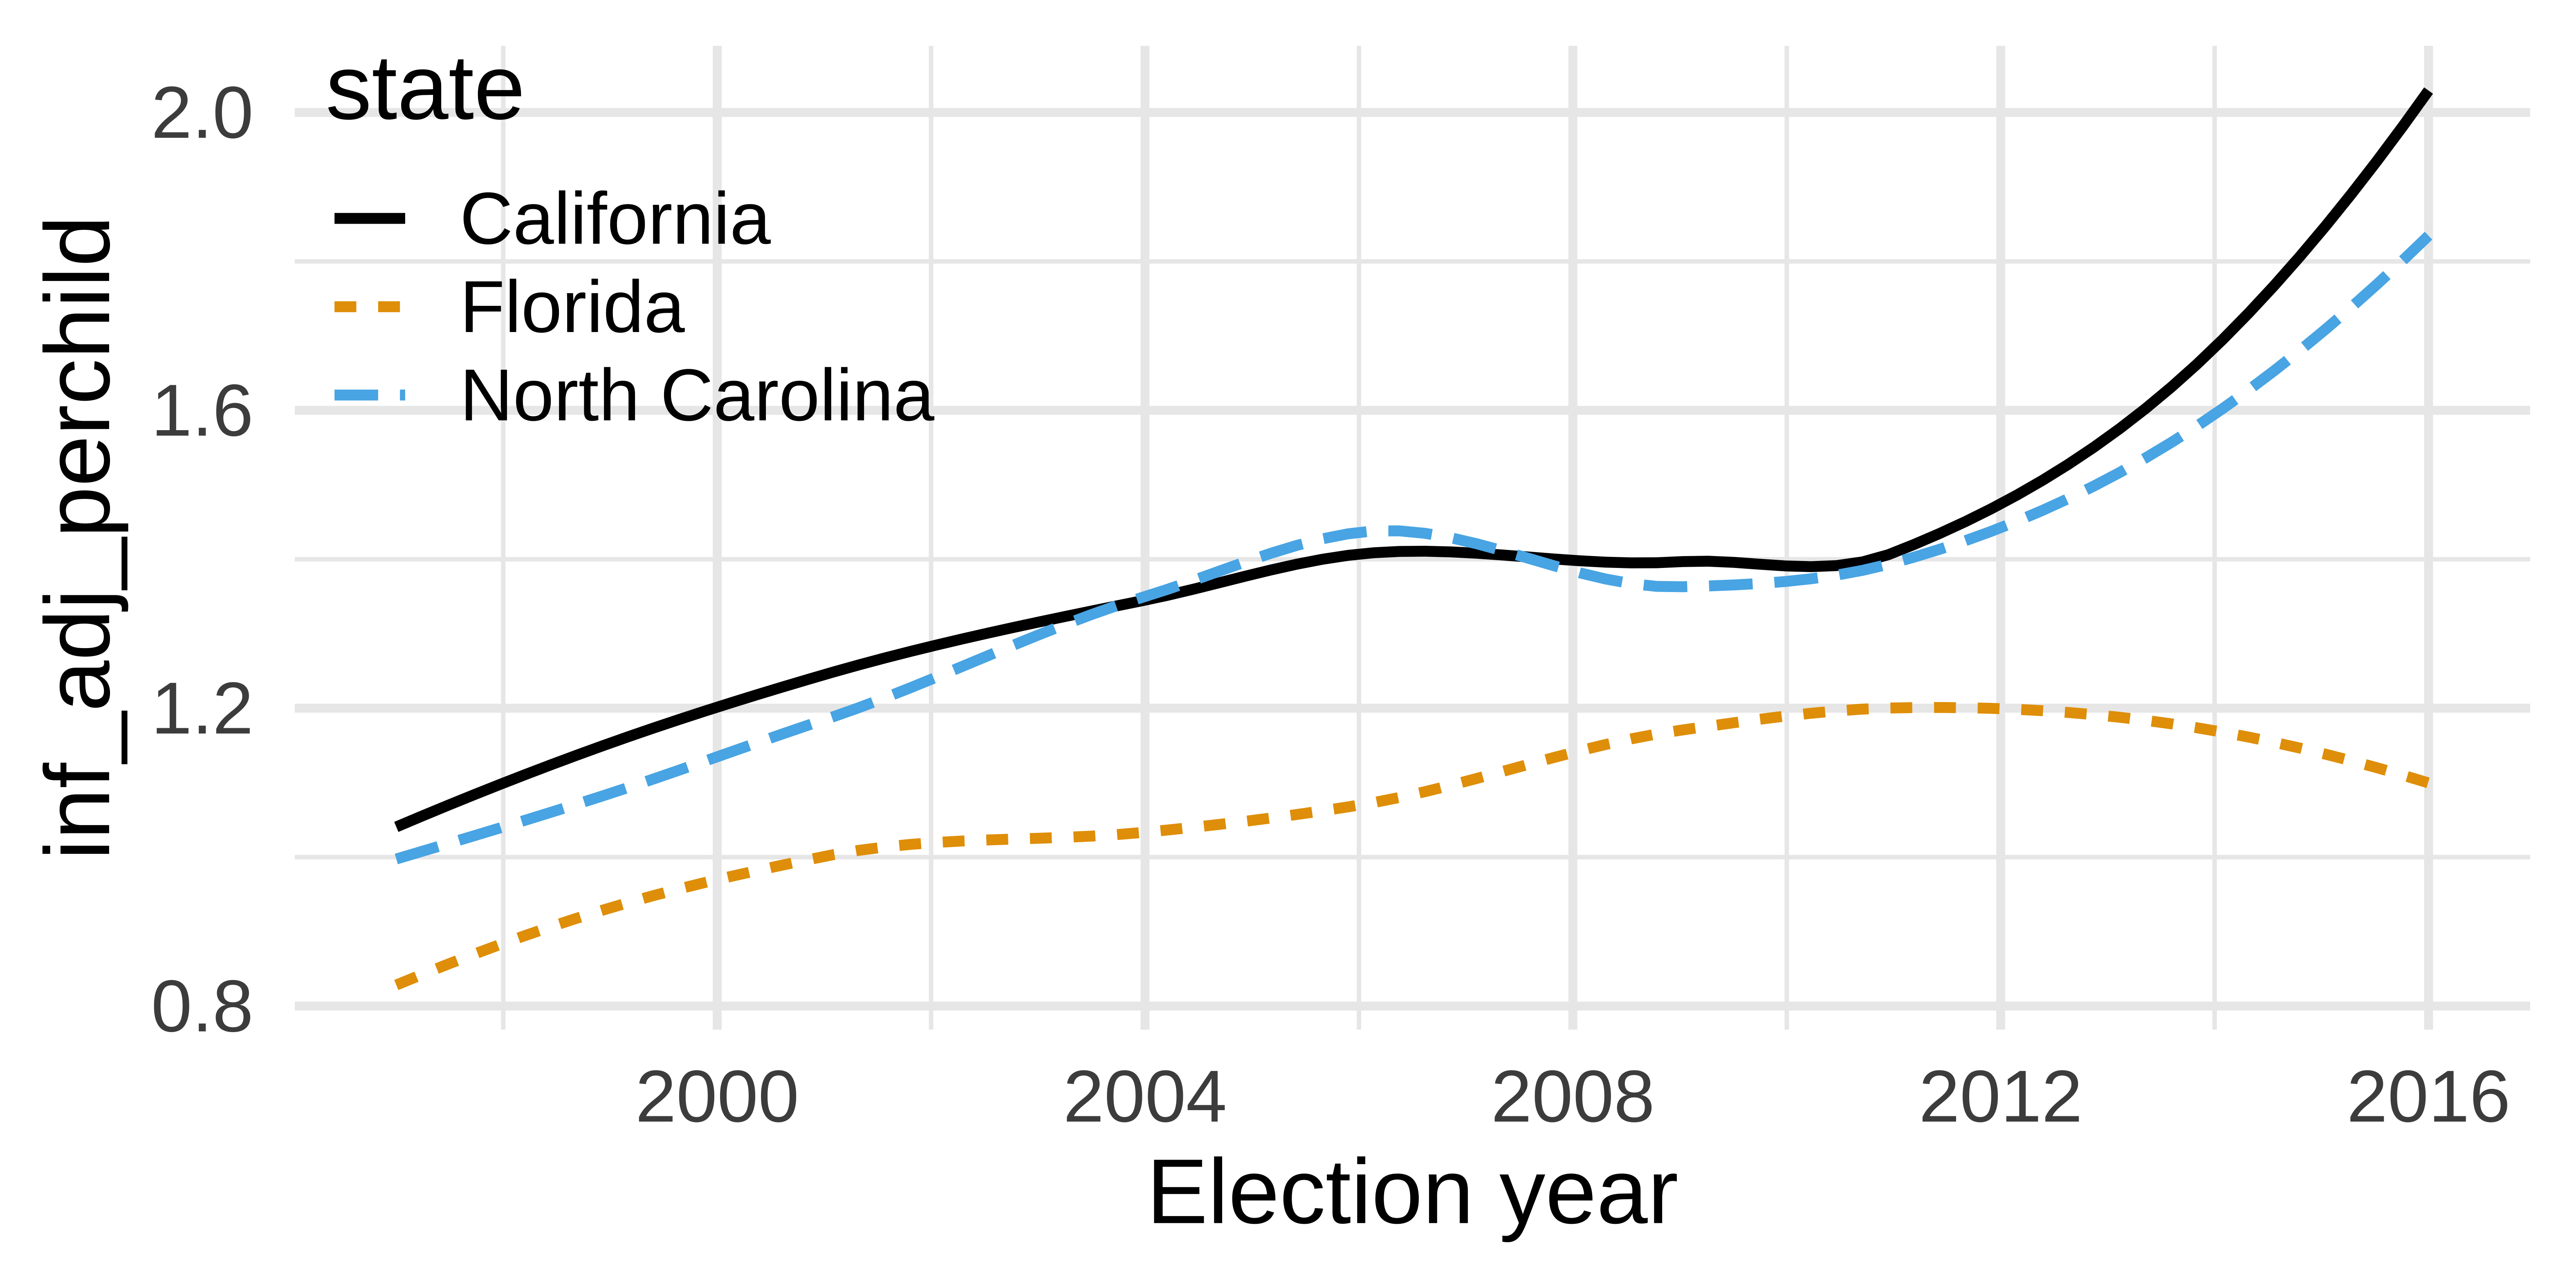
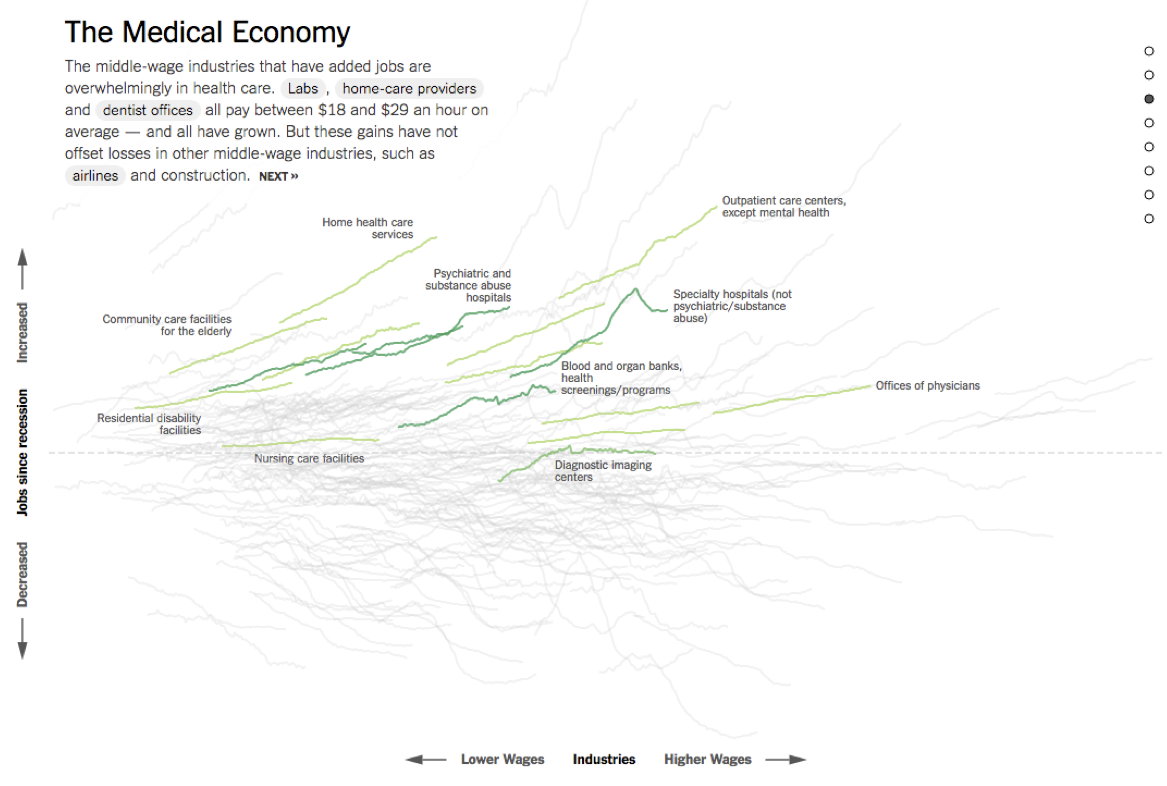
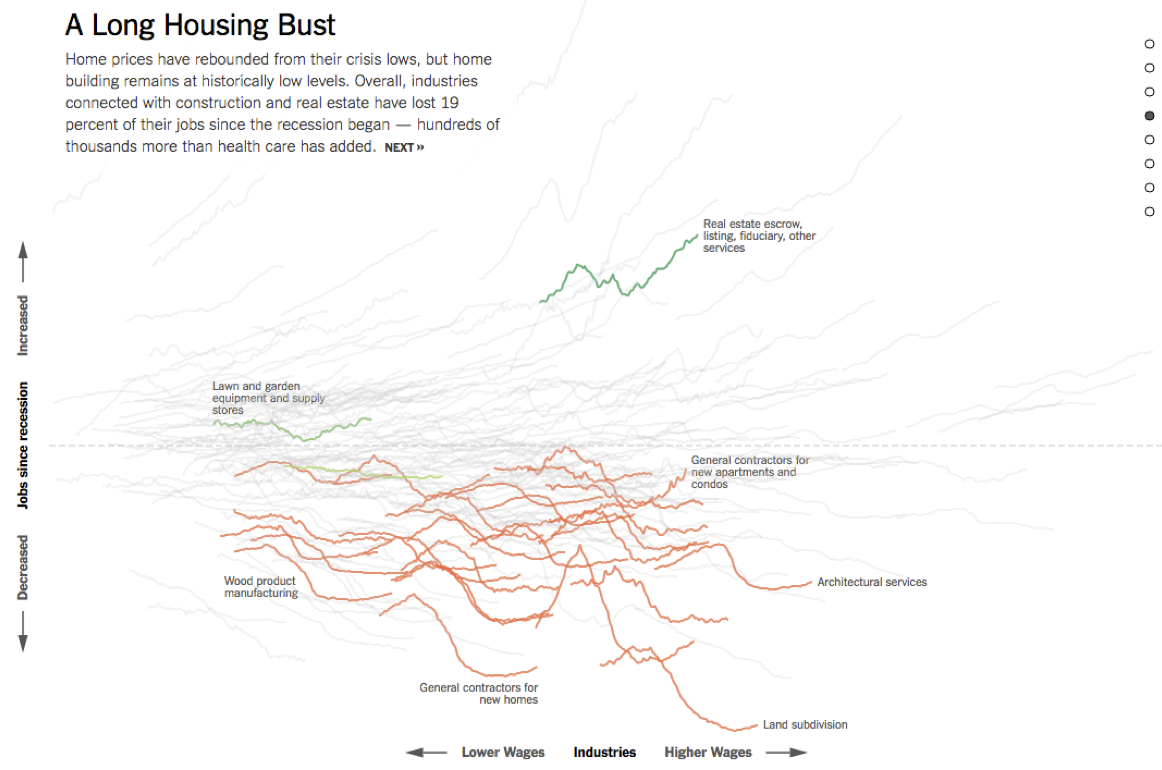
Conciseness matters
Precision matters
Why annotate?
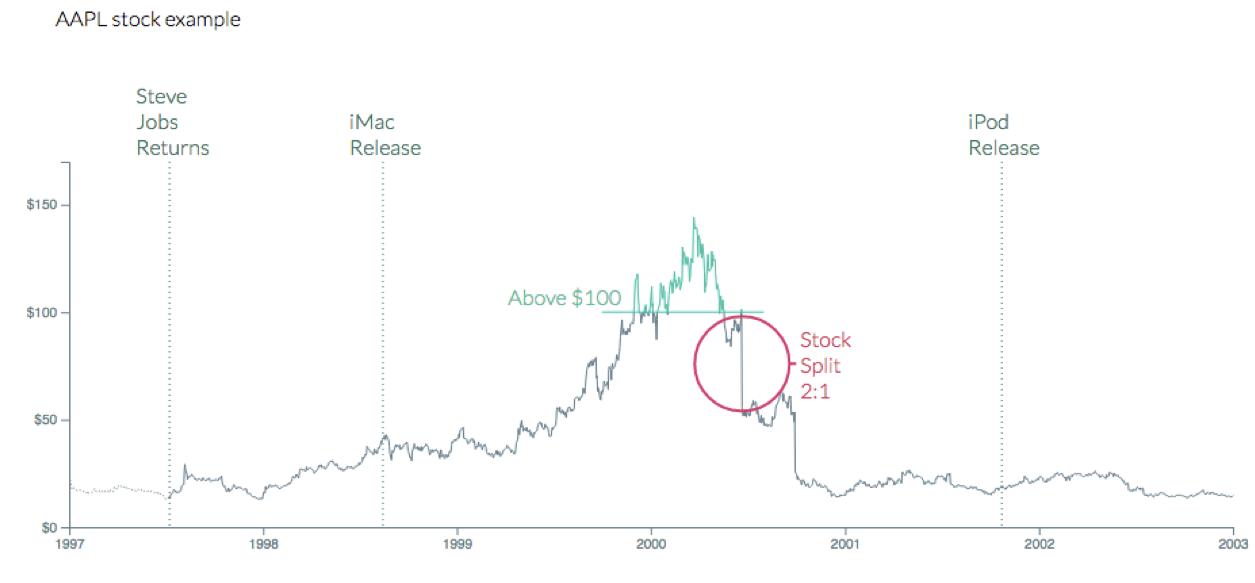
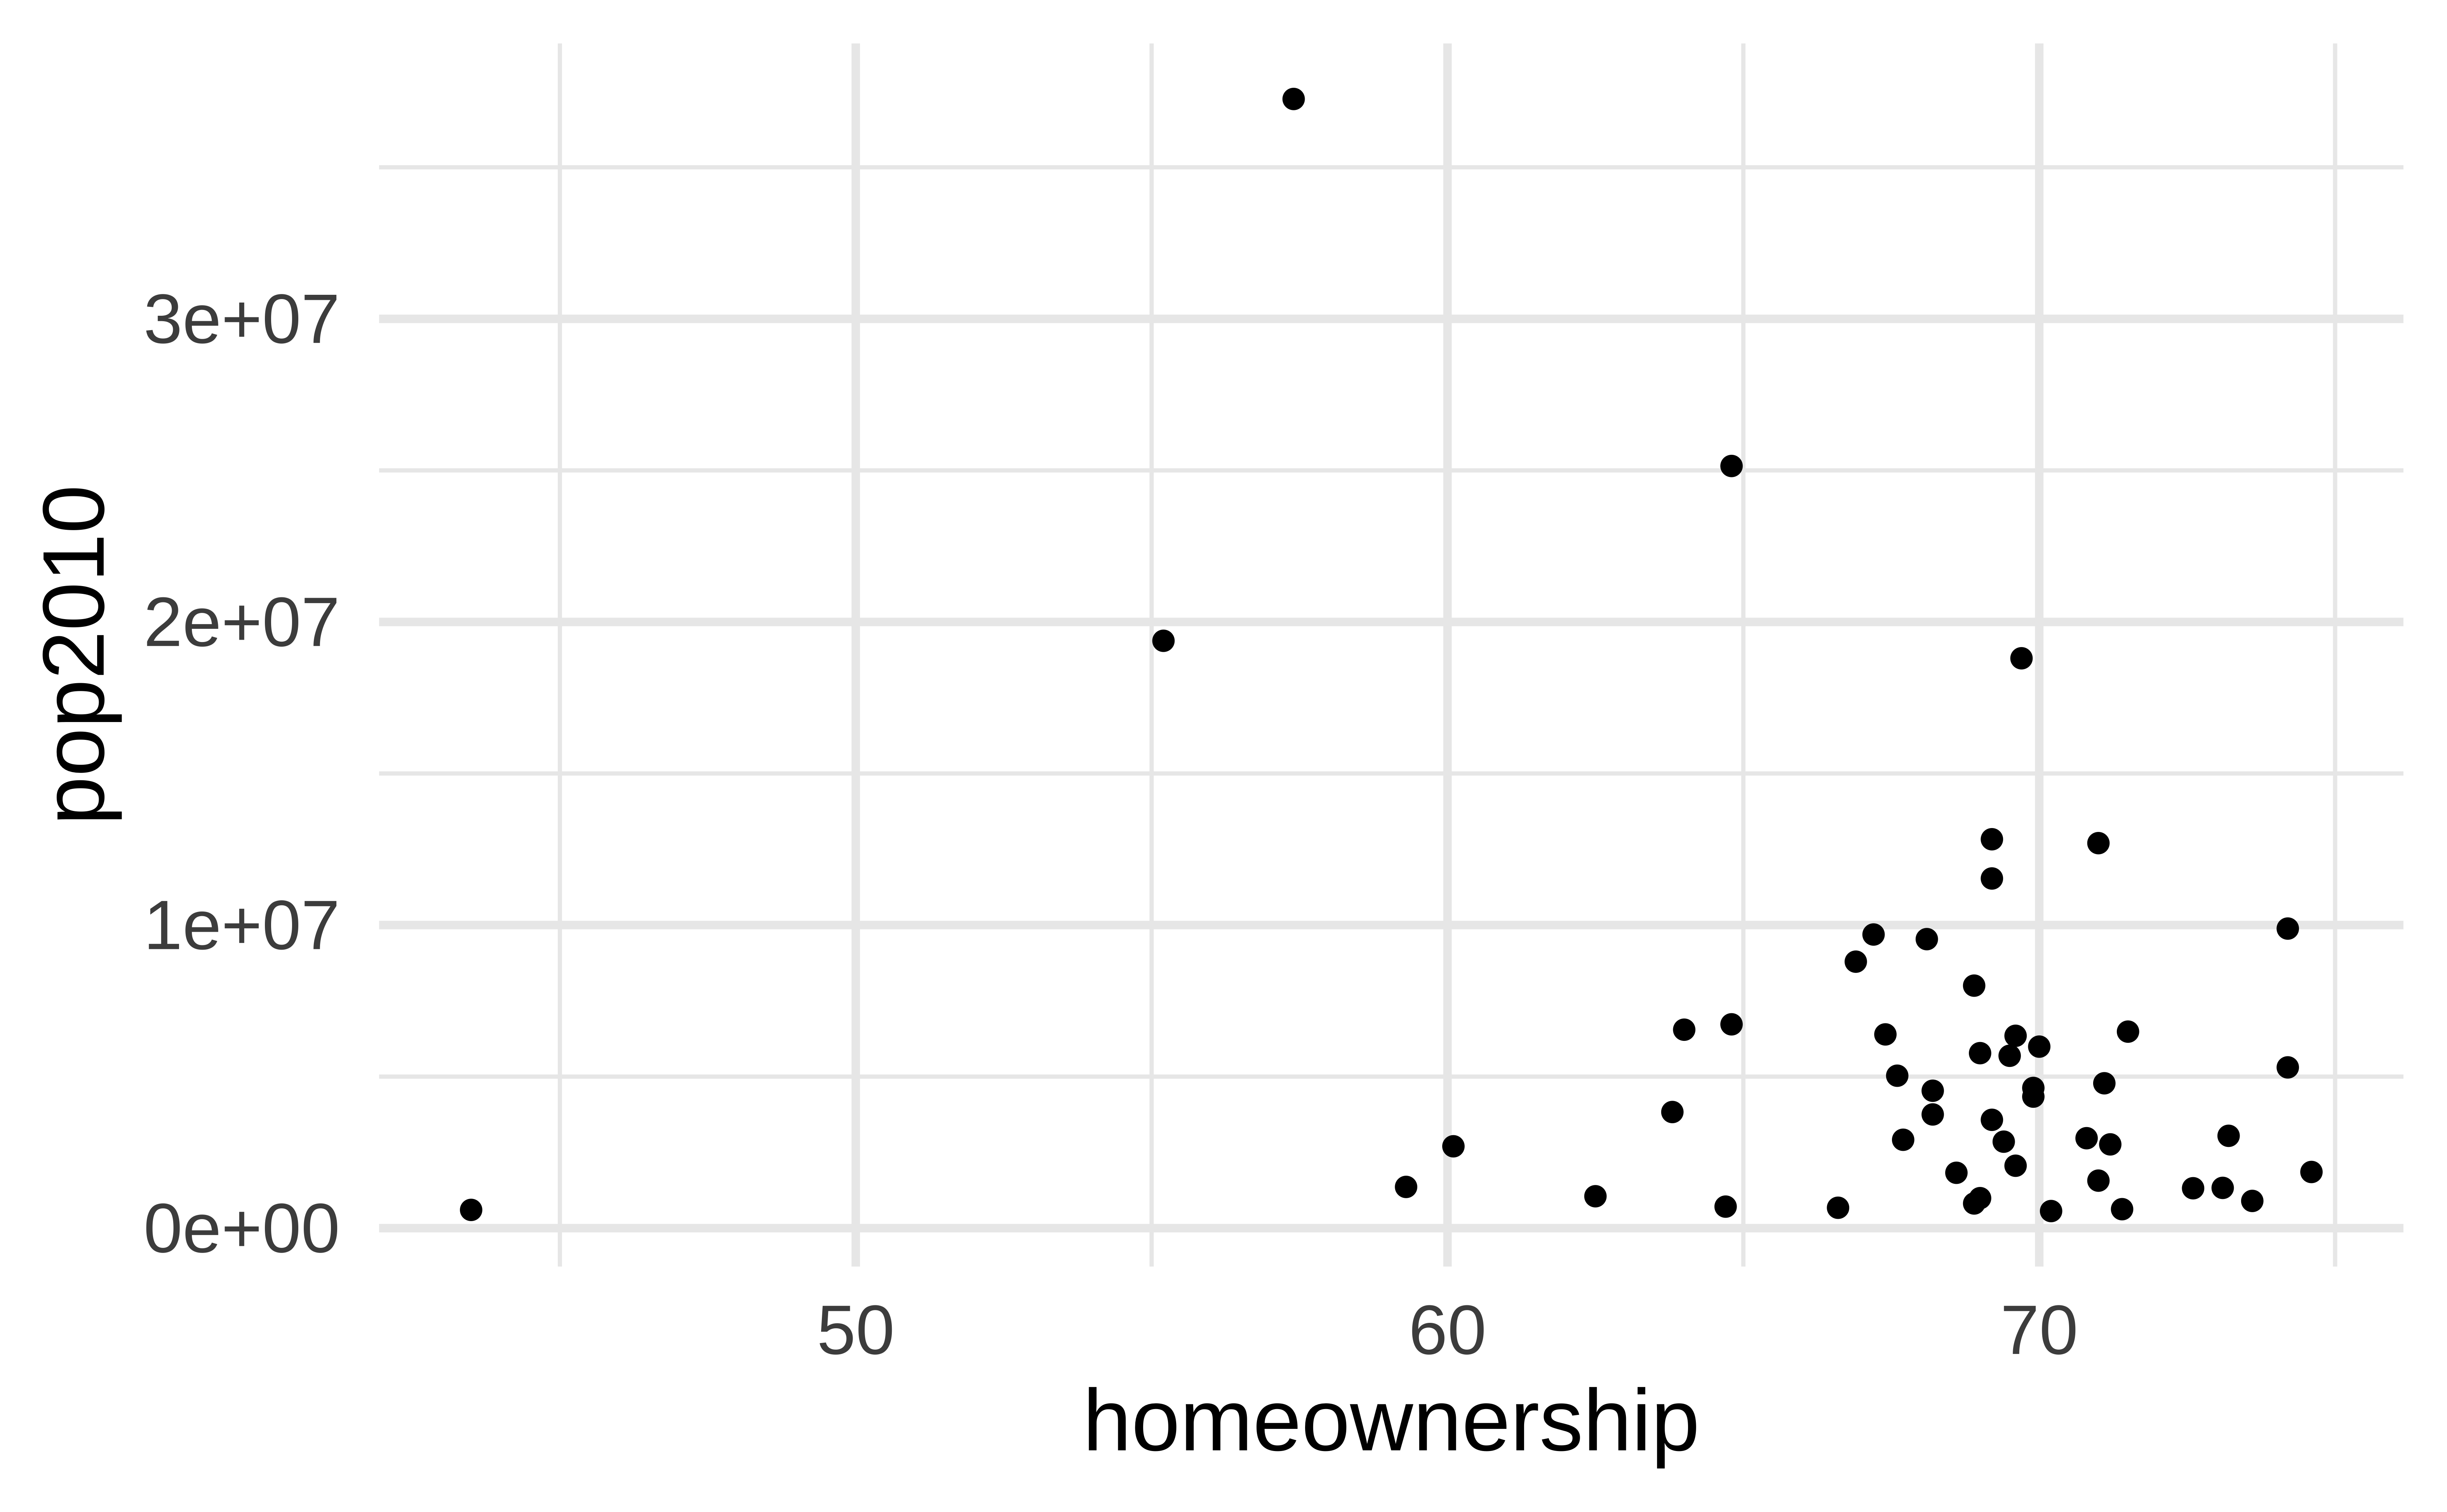
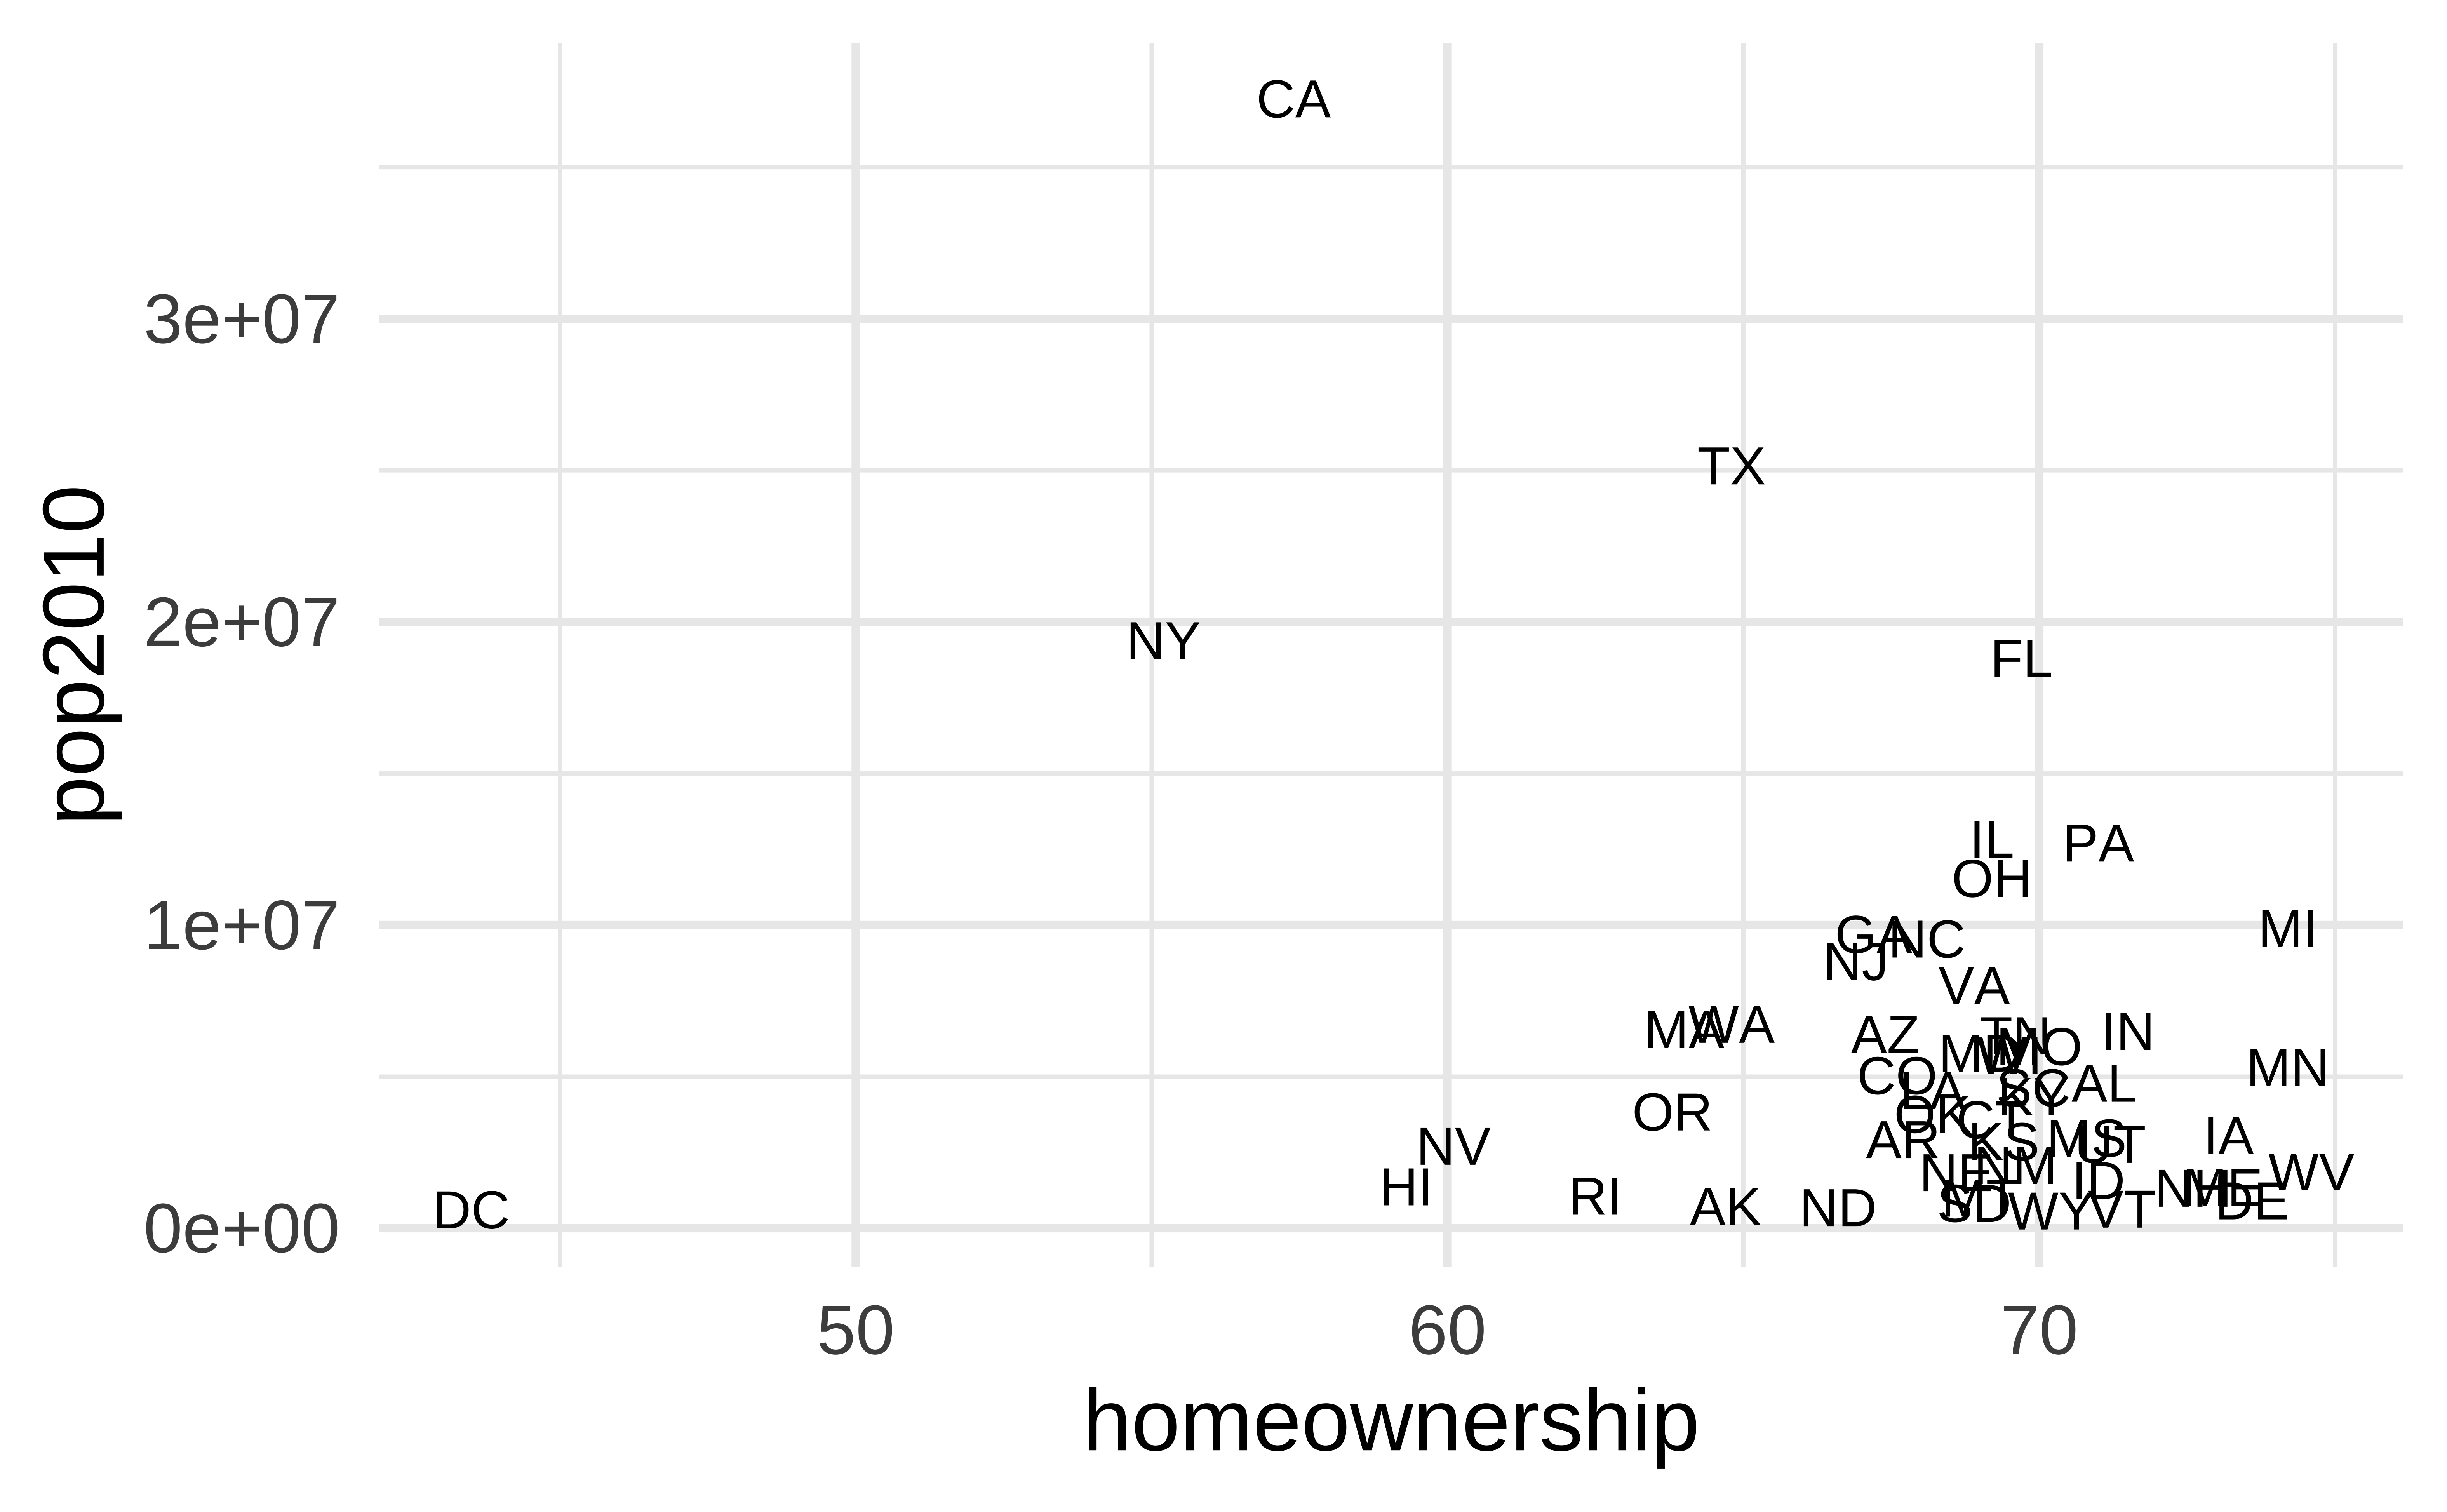
geom_text()
Can be useful when individual observations are identifiable, but can also get overwhelming…
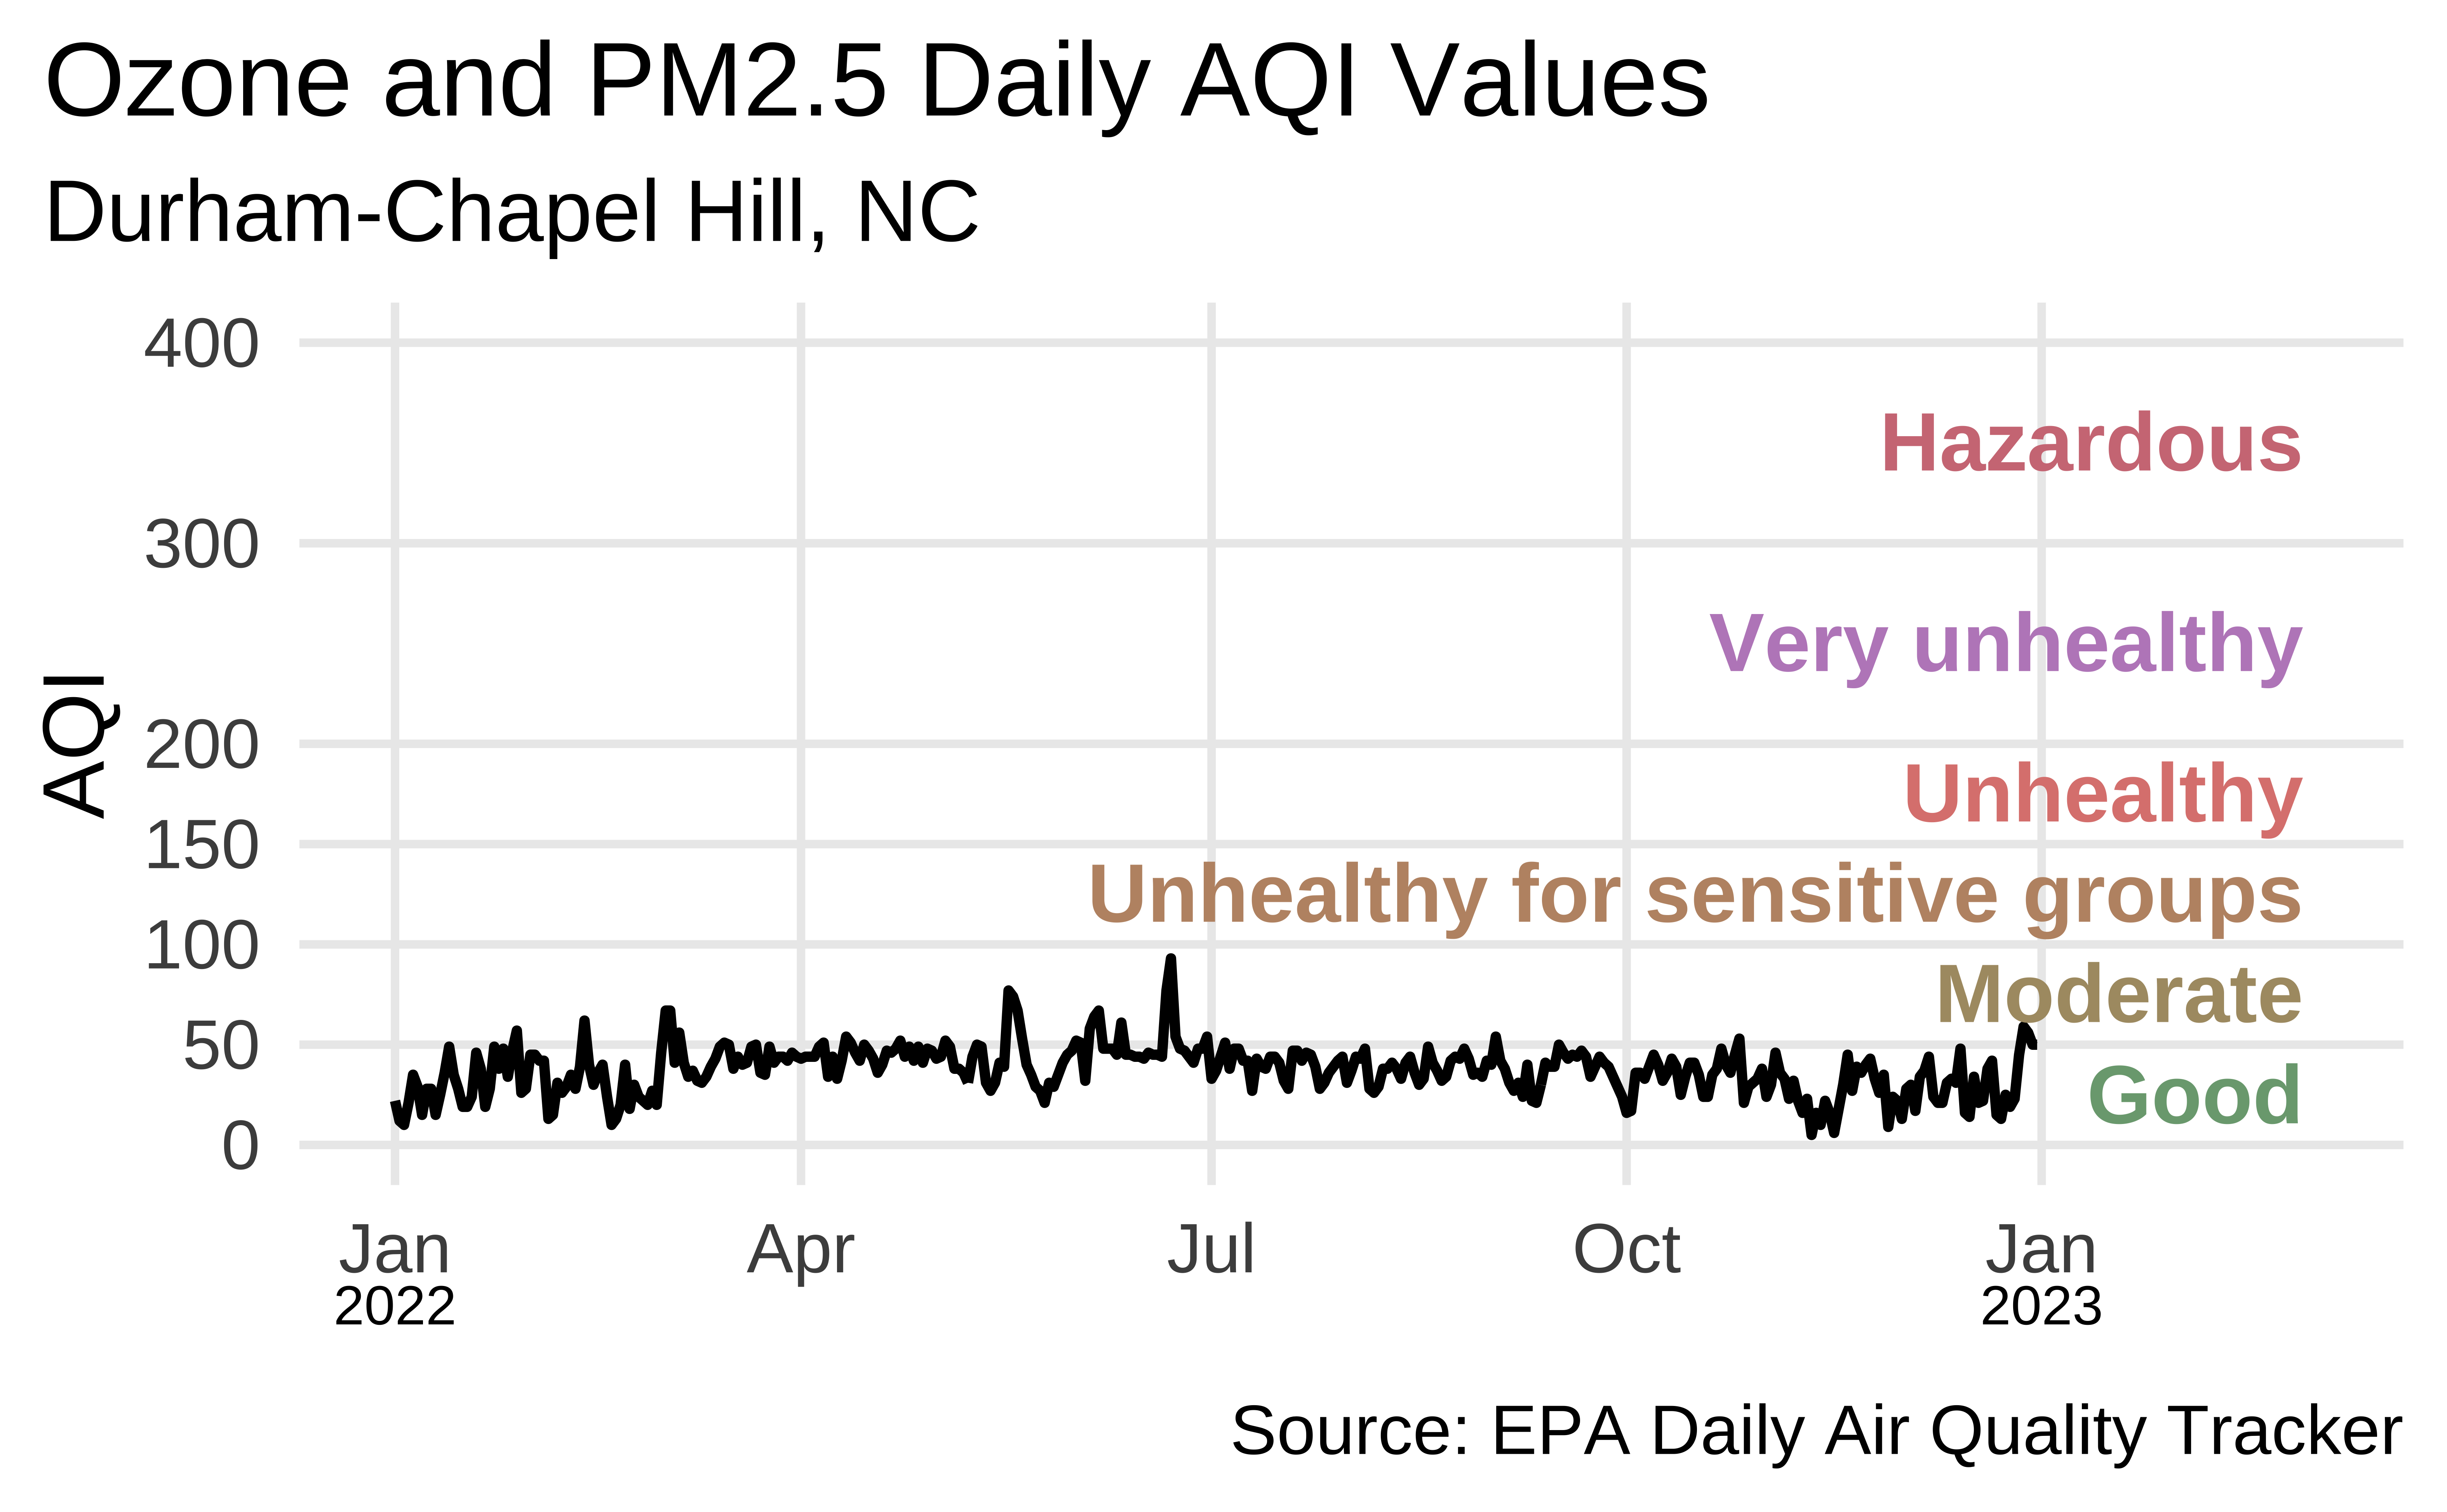
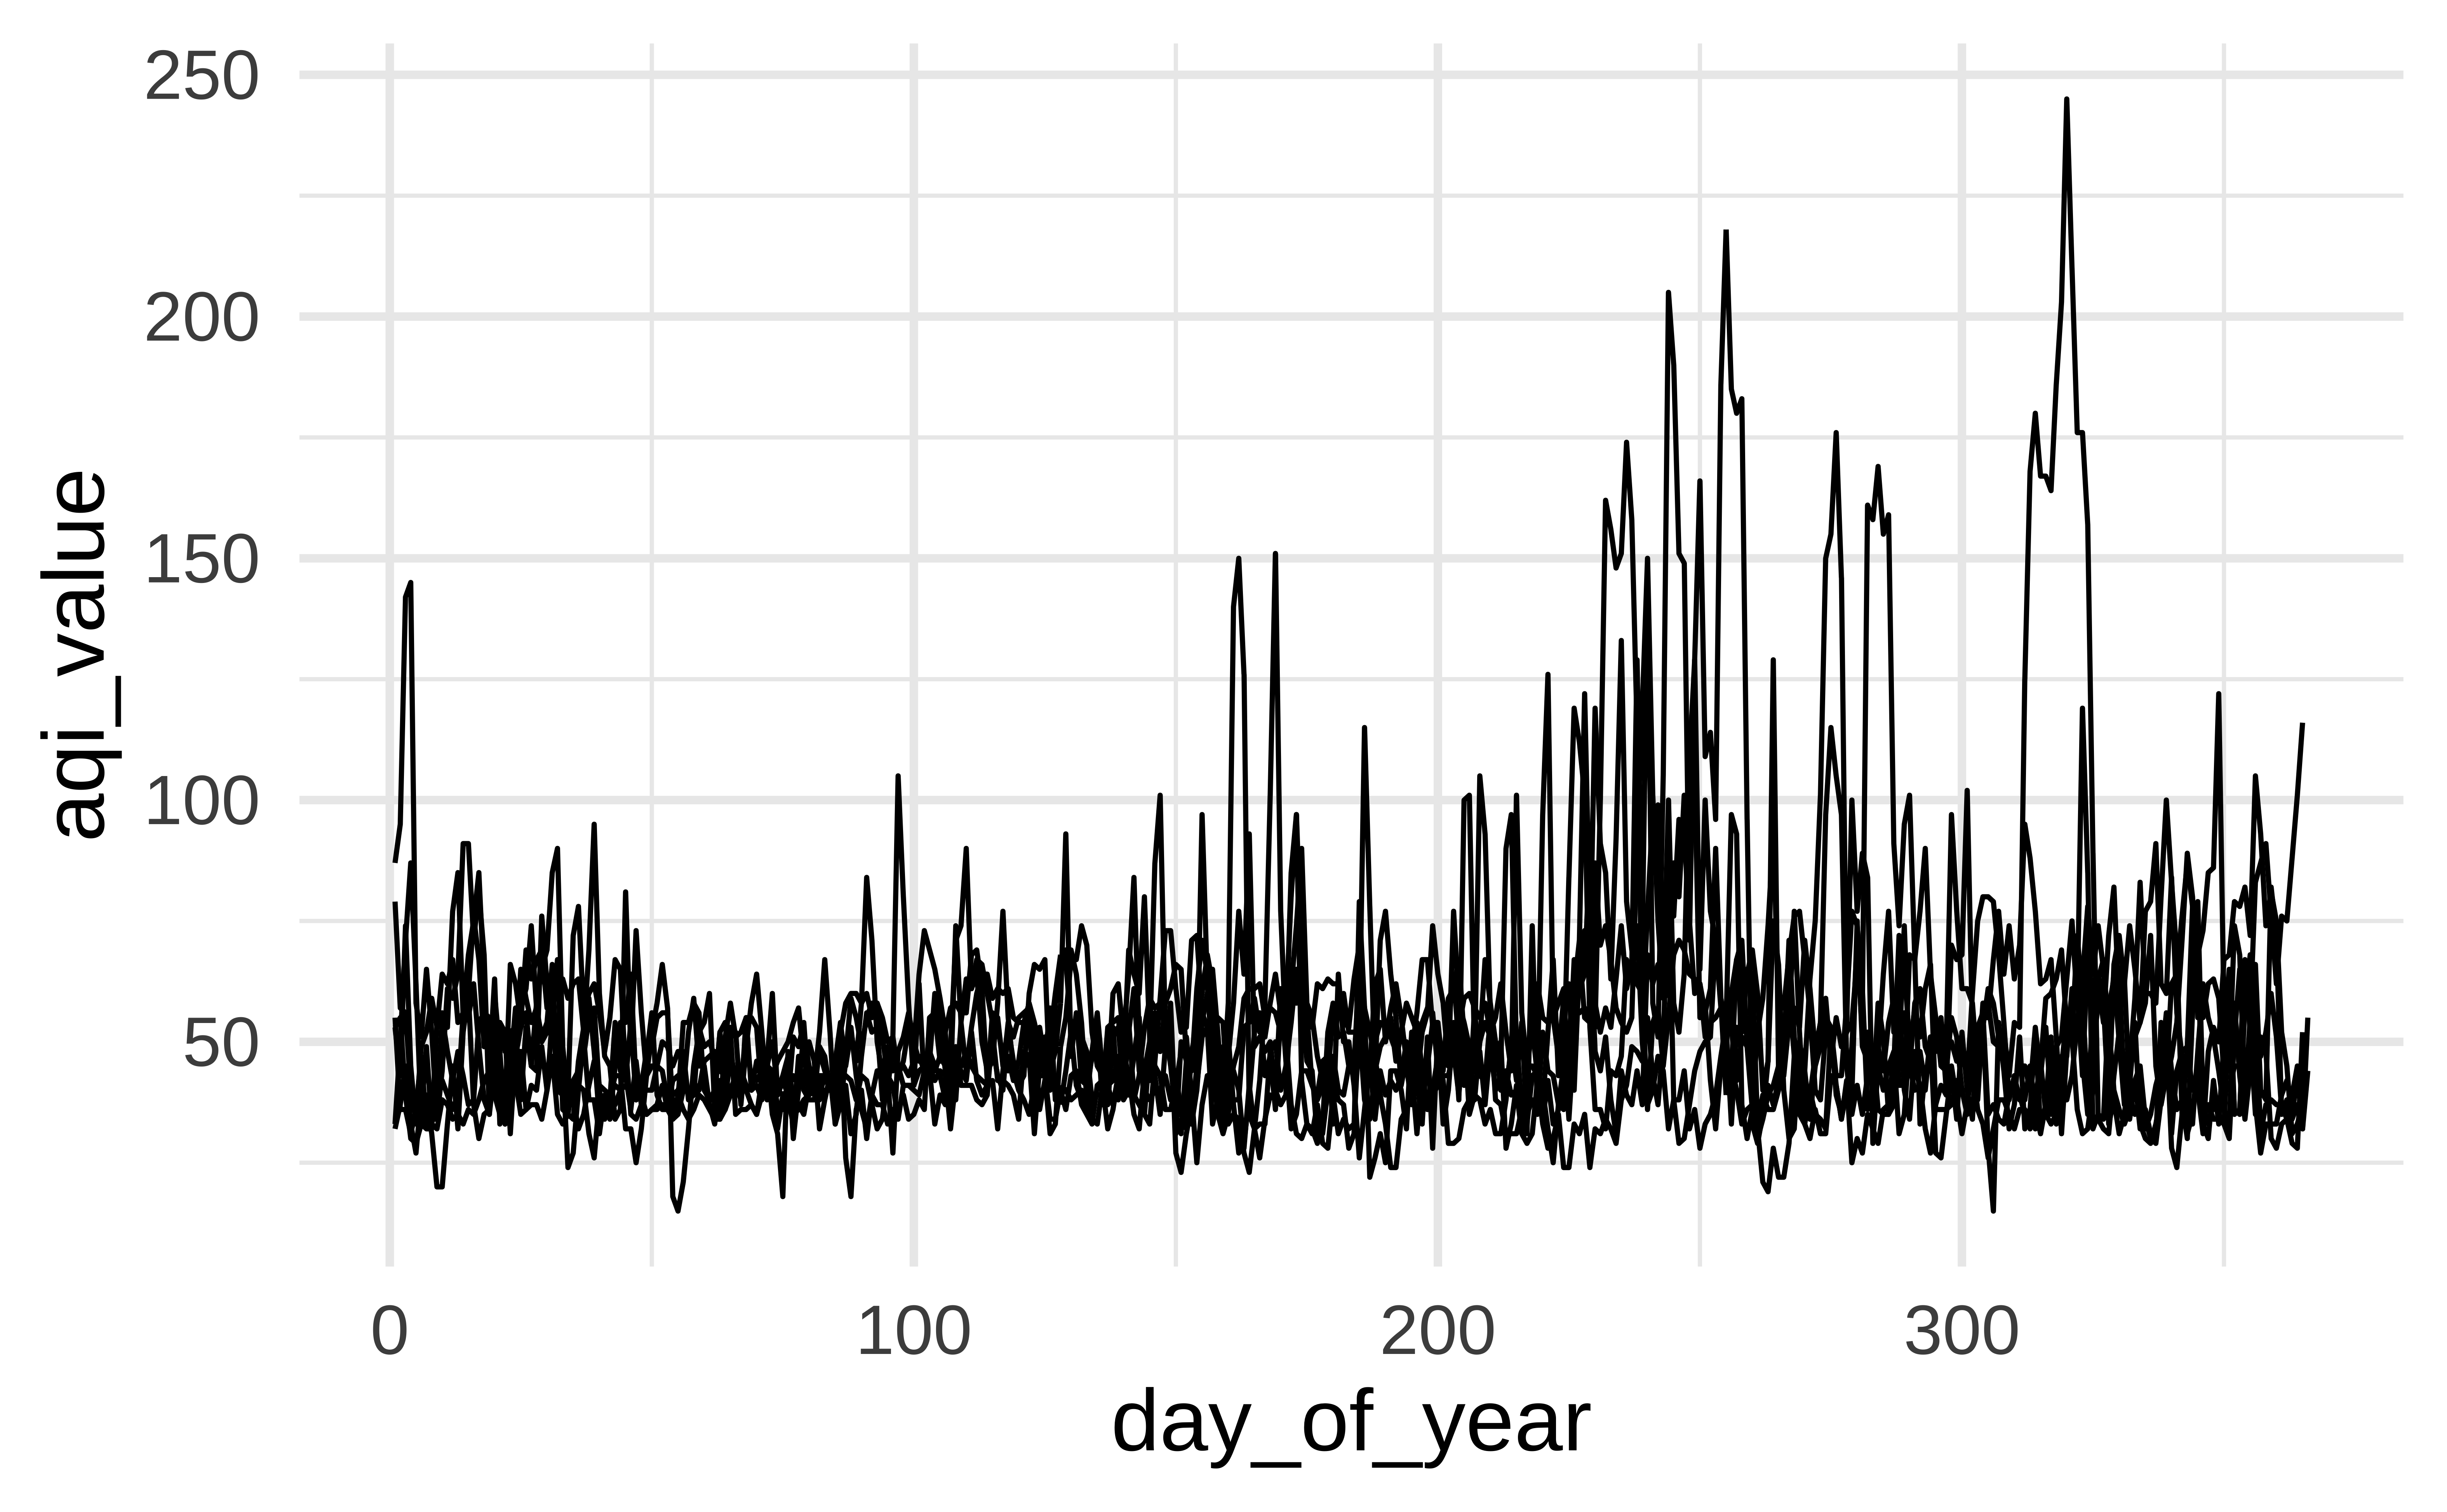
Revisit Durham AQI
Recreate the following visualization, in Part 2 of ae-06.
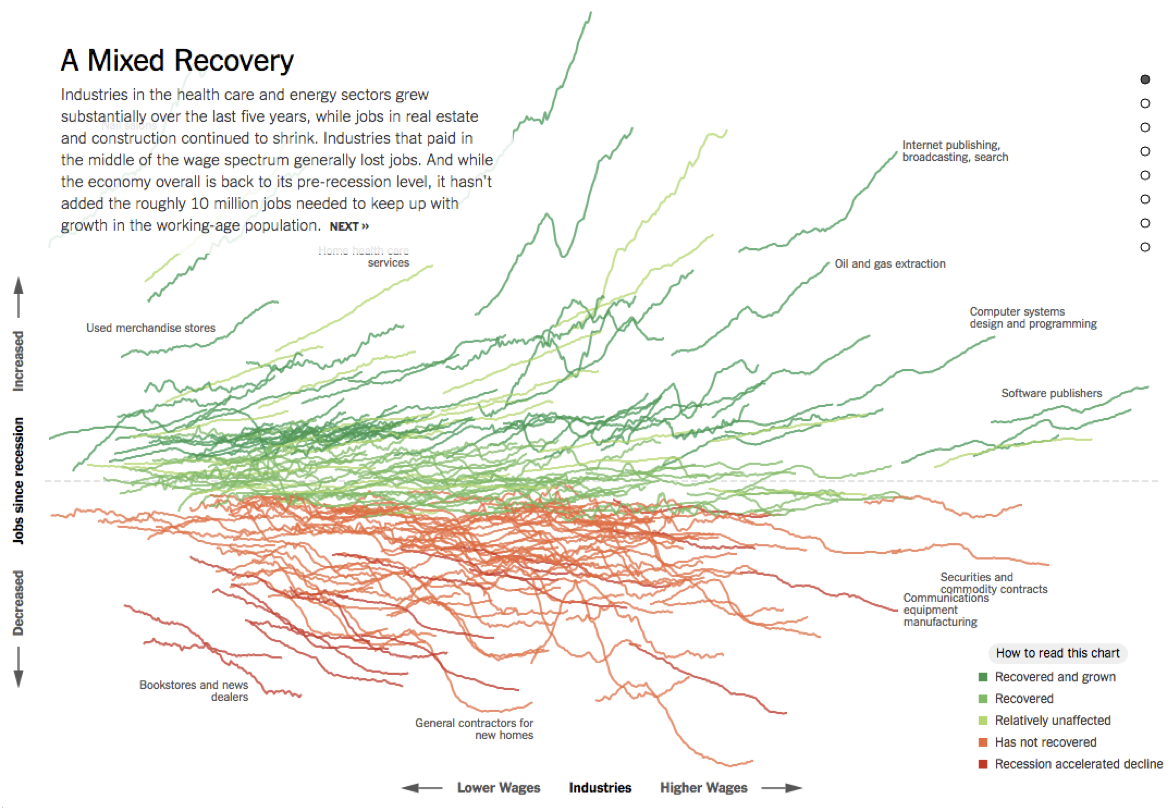
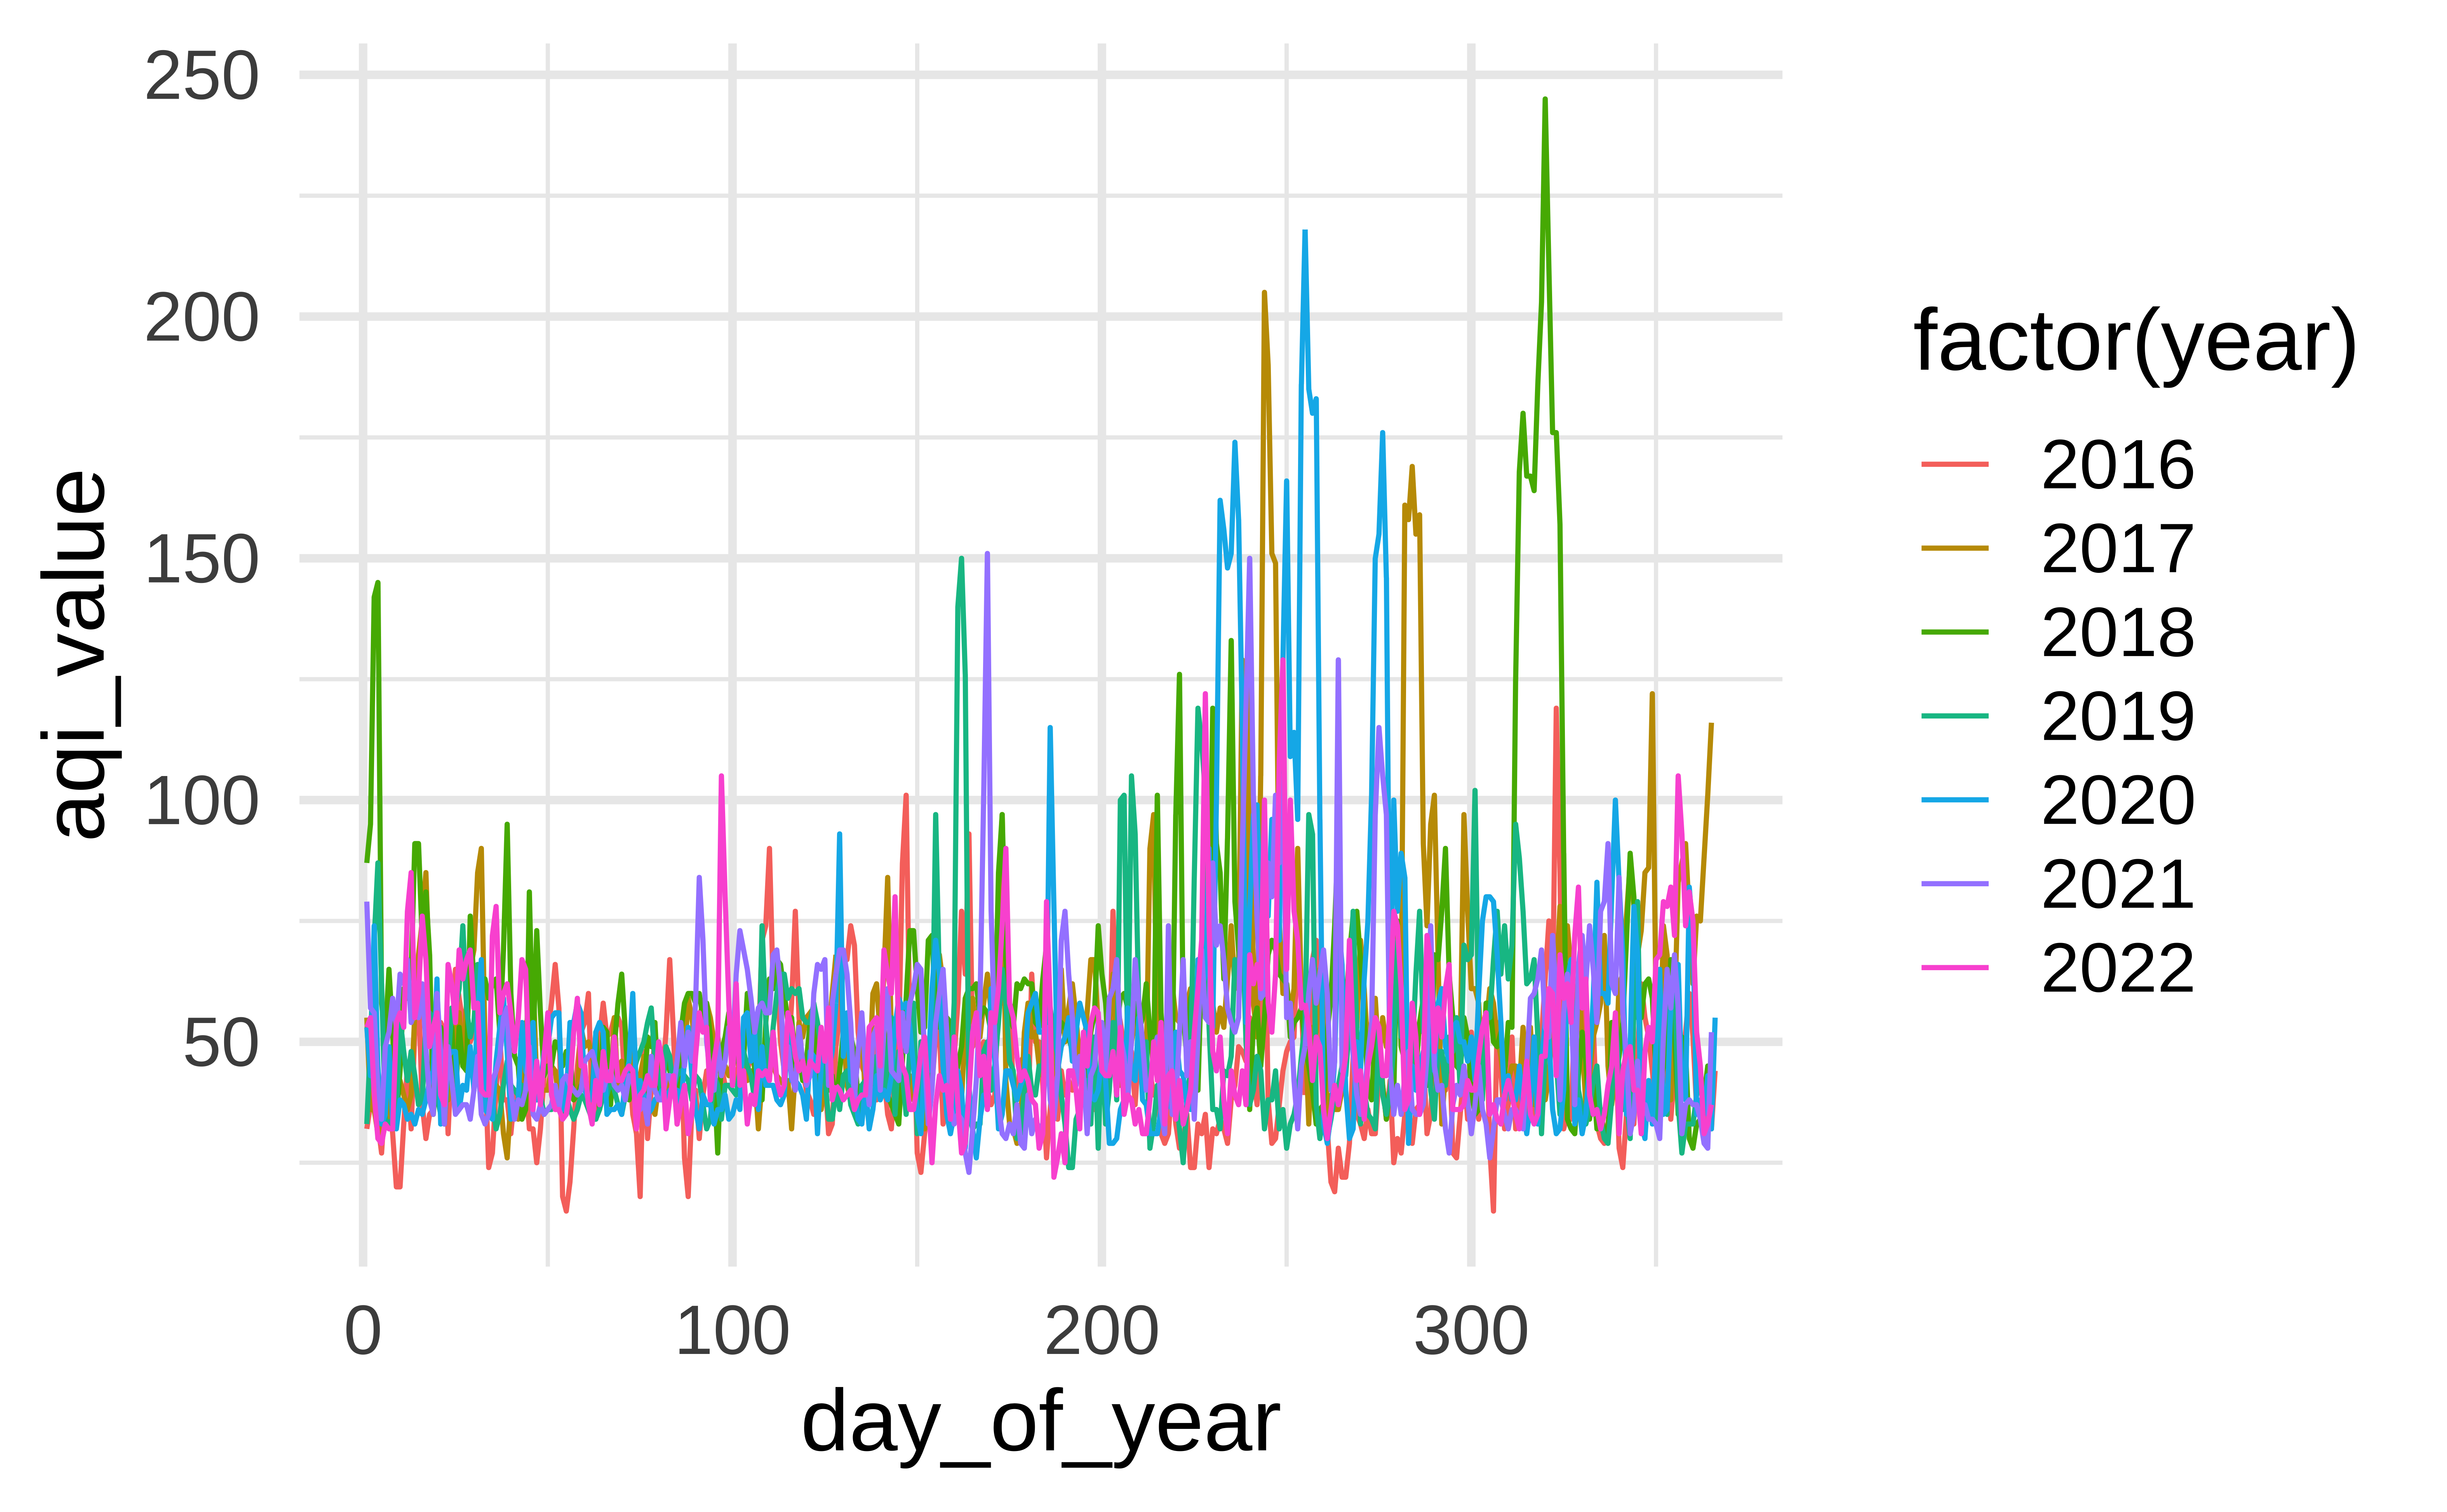
All of the data doesn’t tell a story
Plot AQI over years
Plot AQI over years
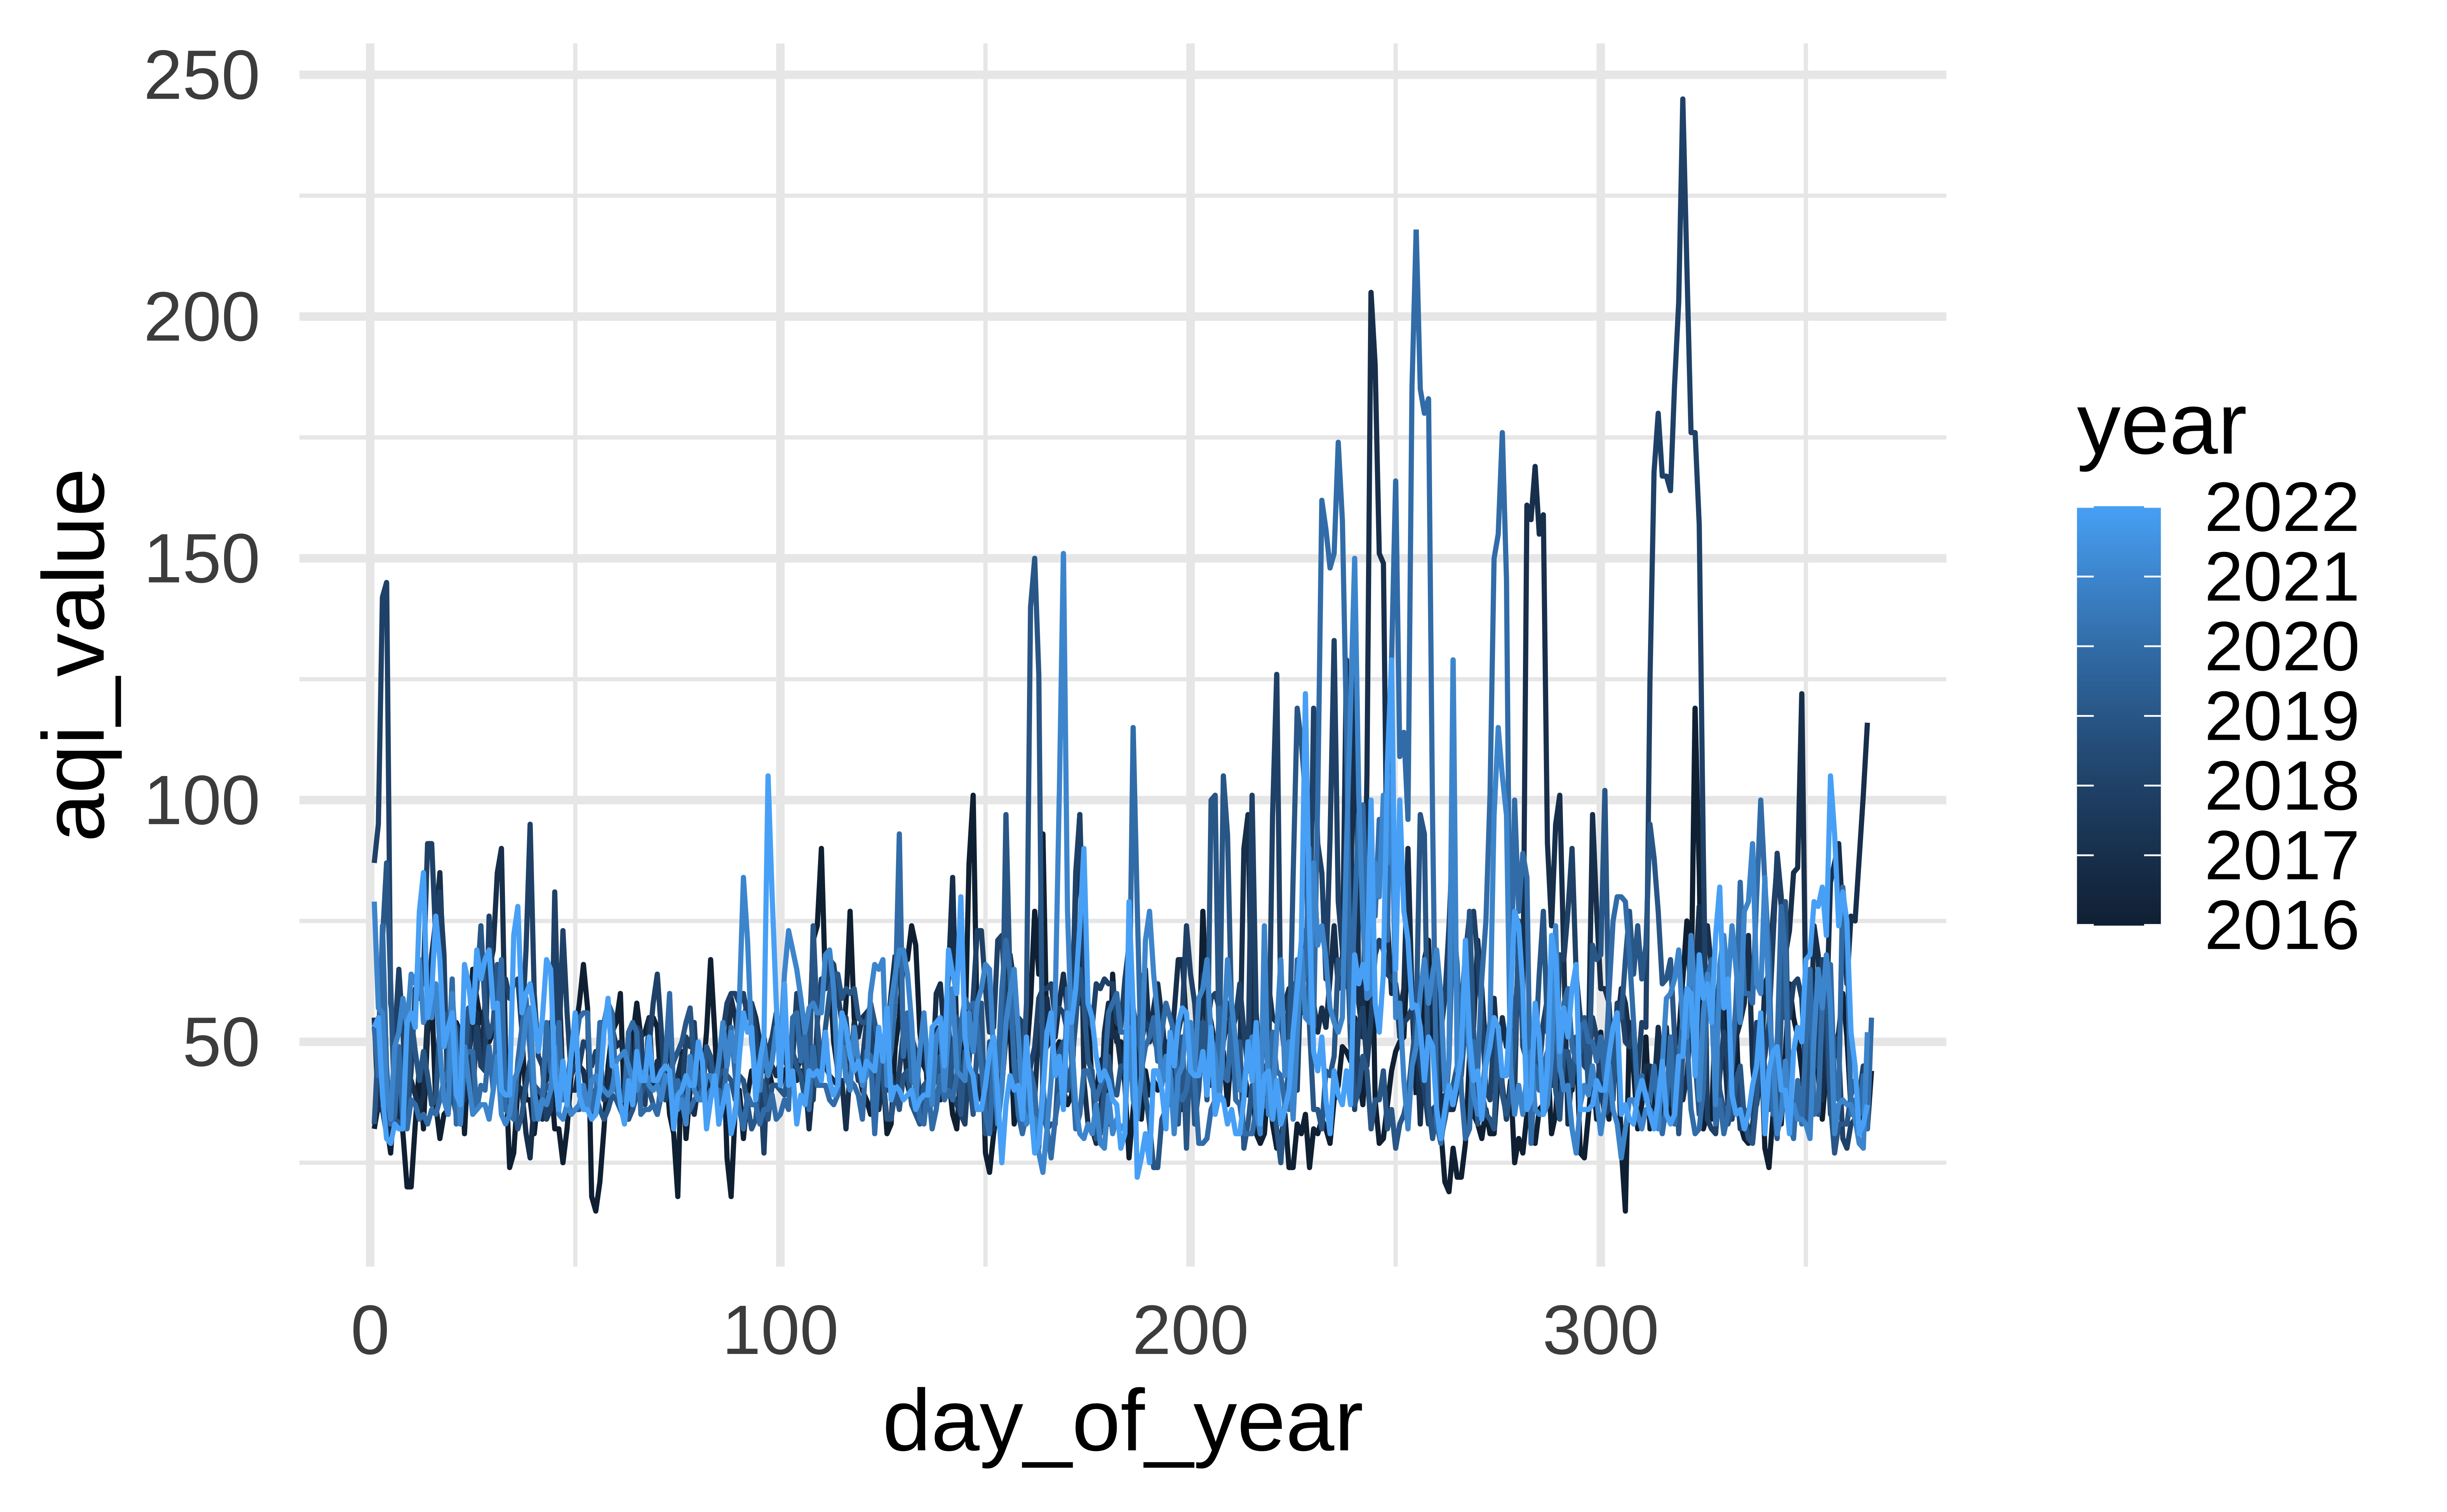
Plot AQI over years
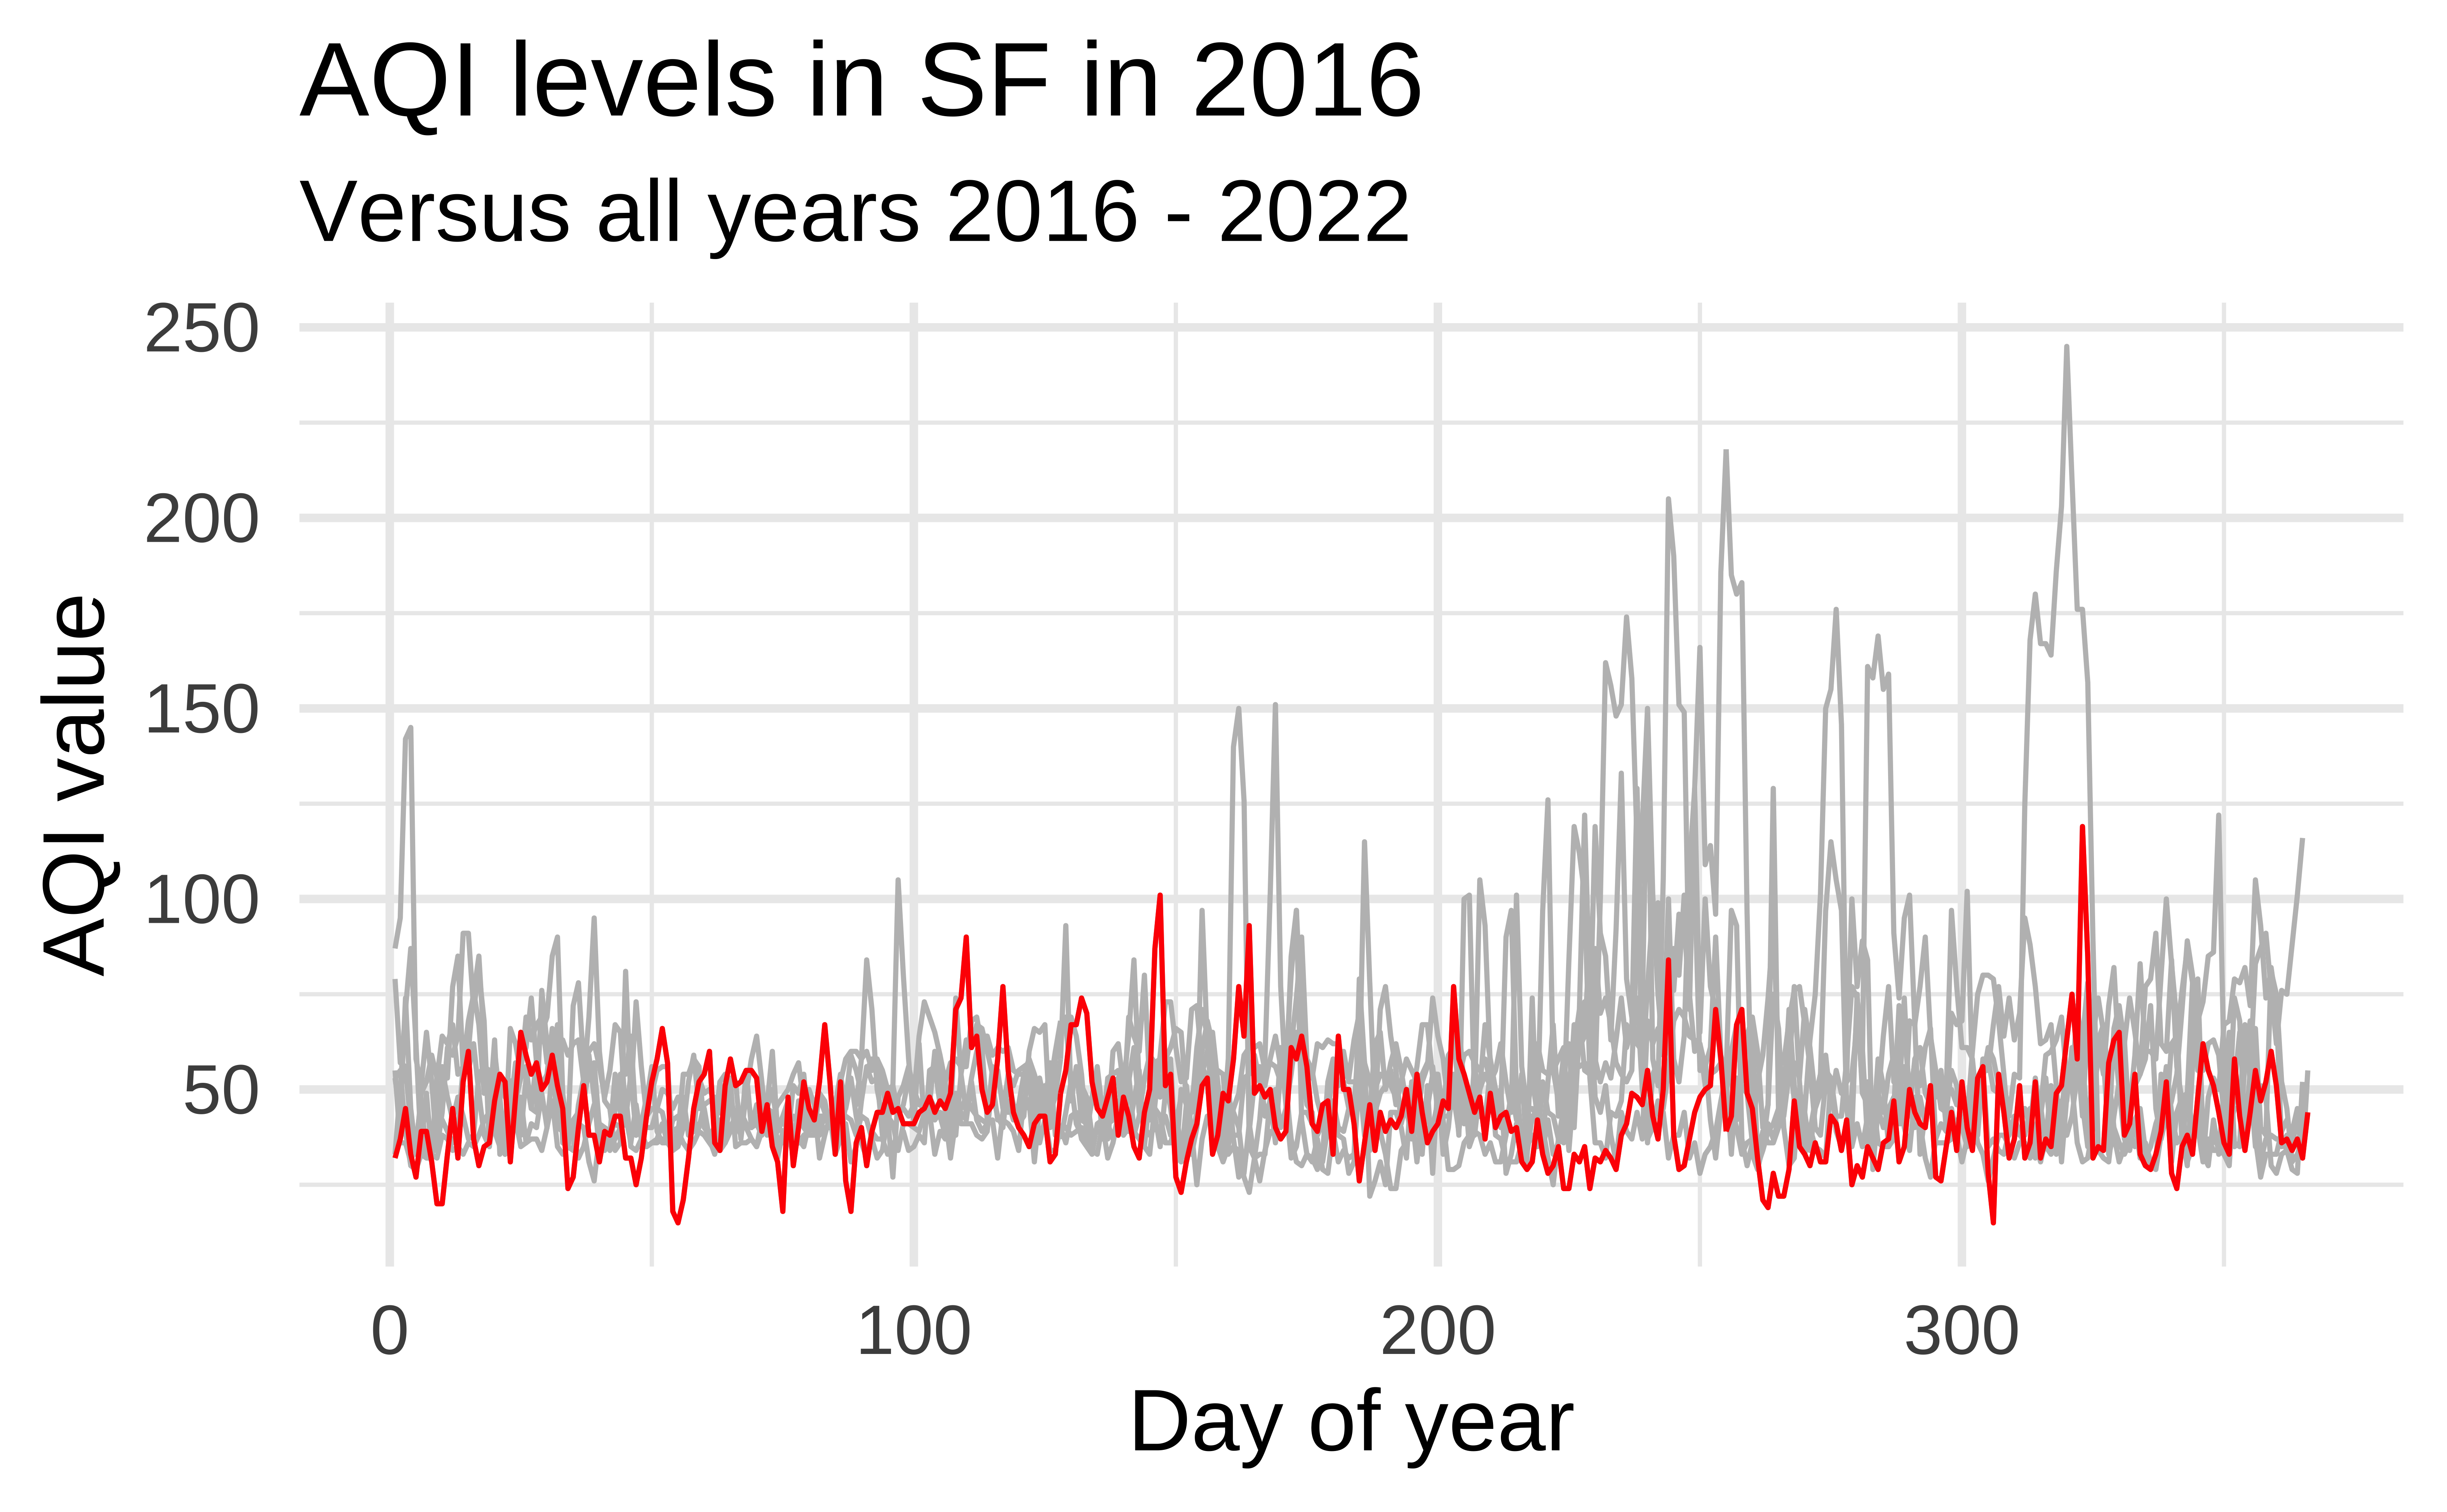
Highlight 2016
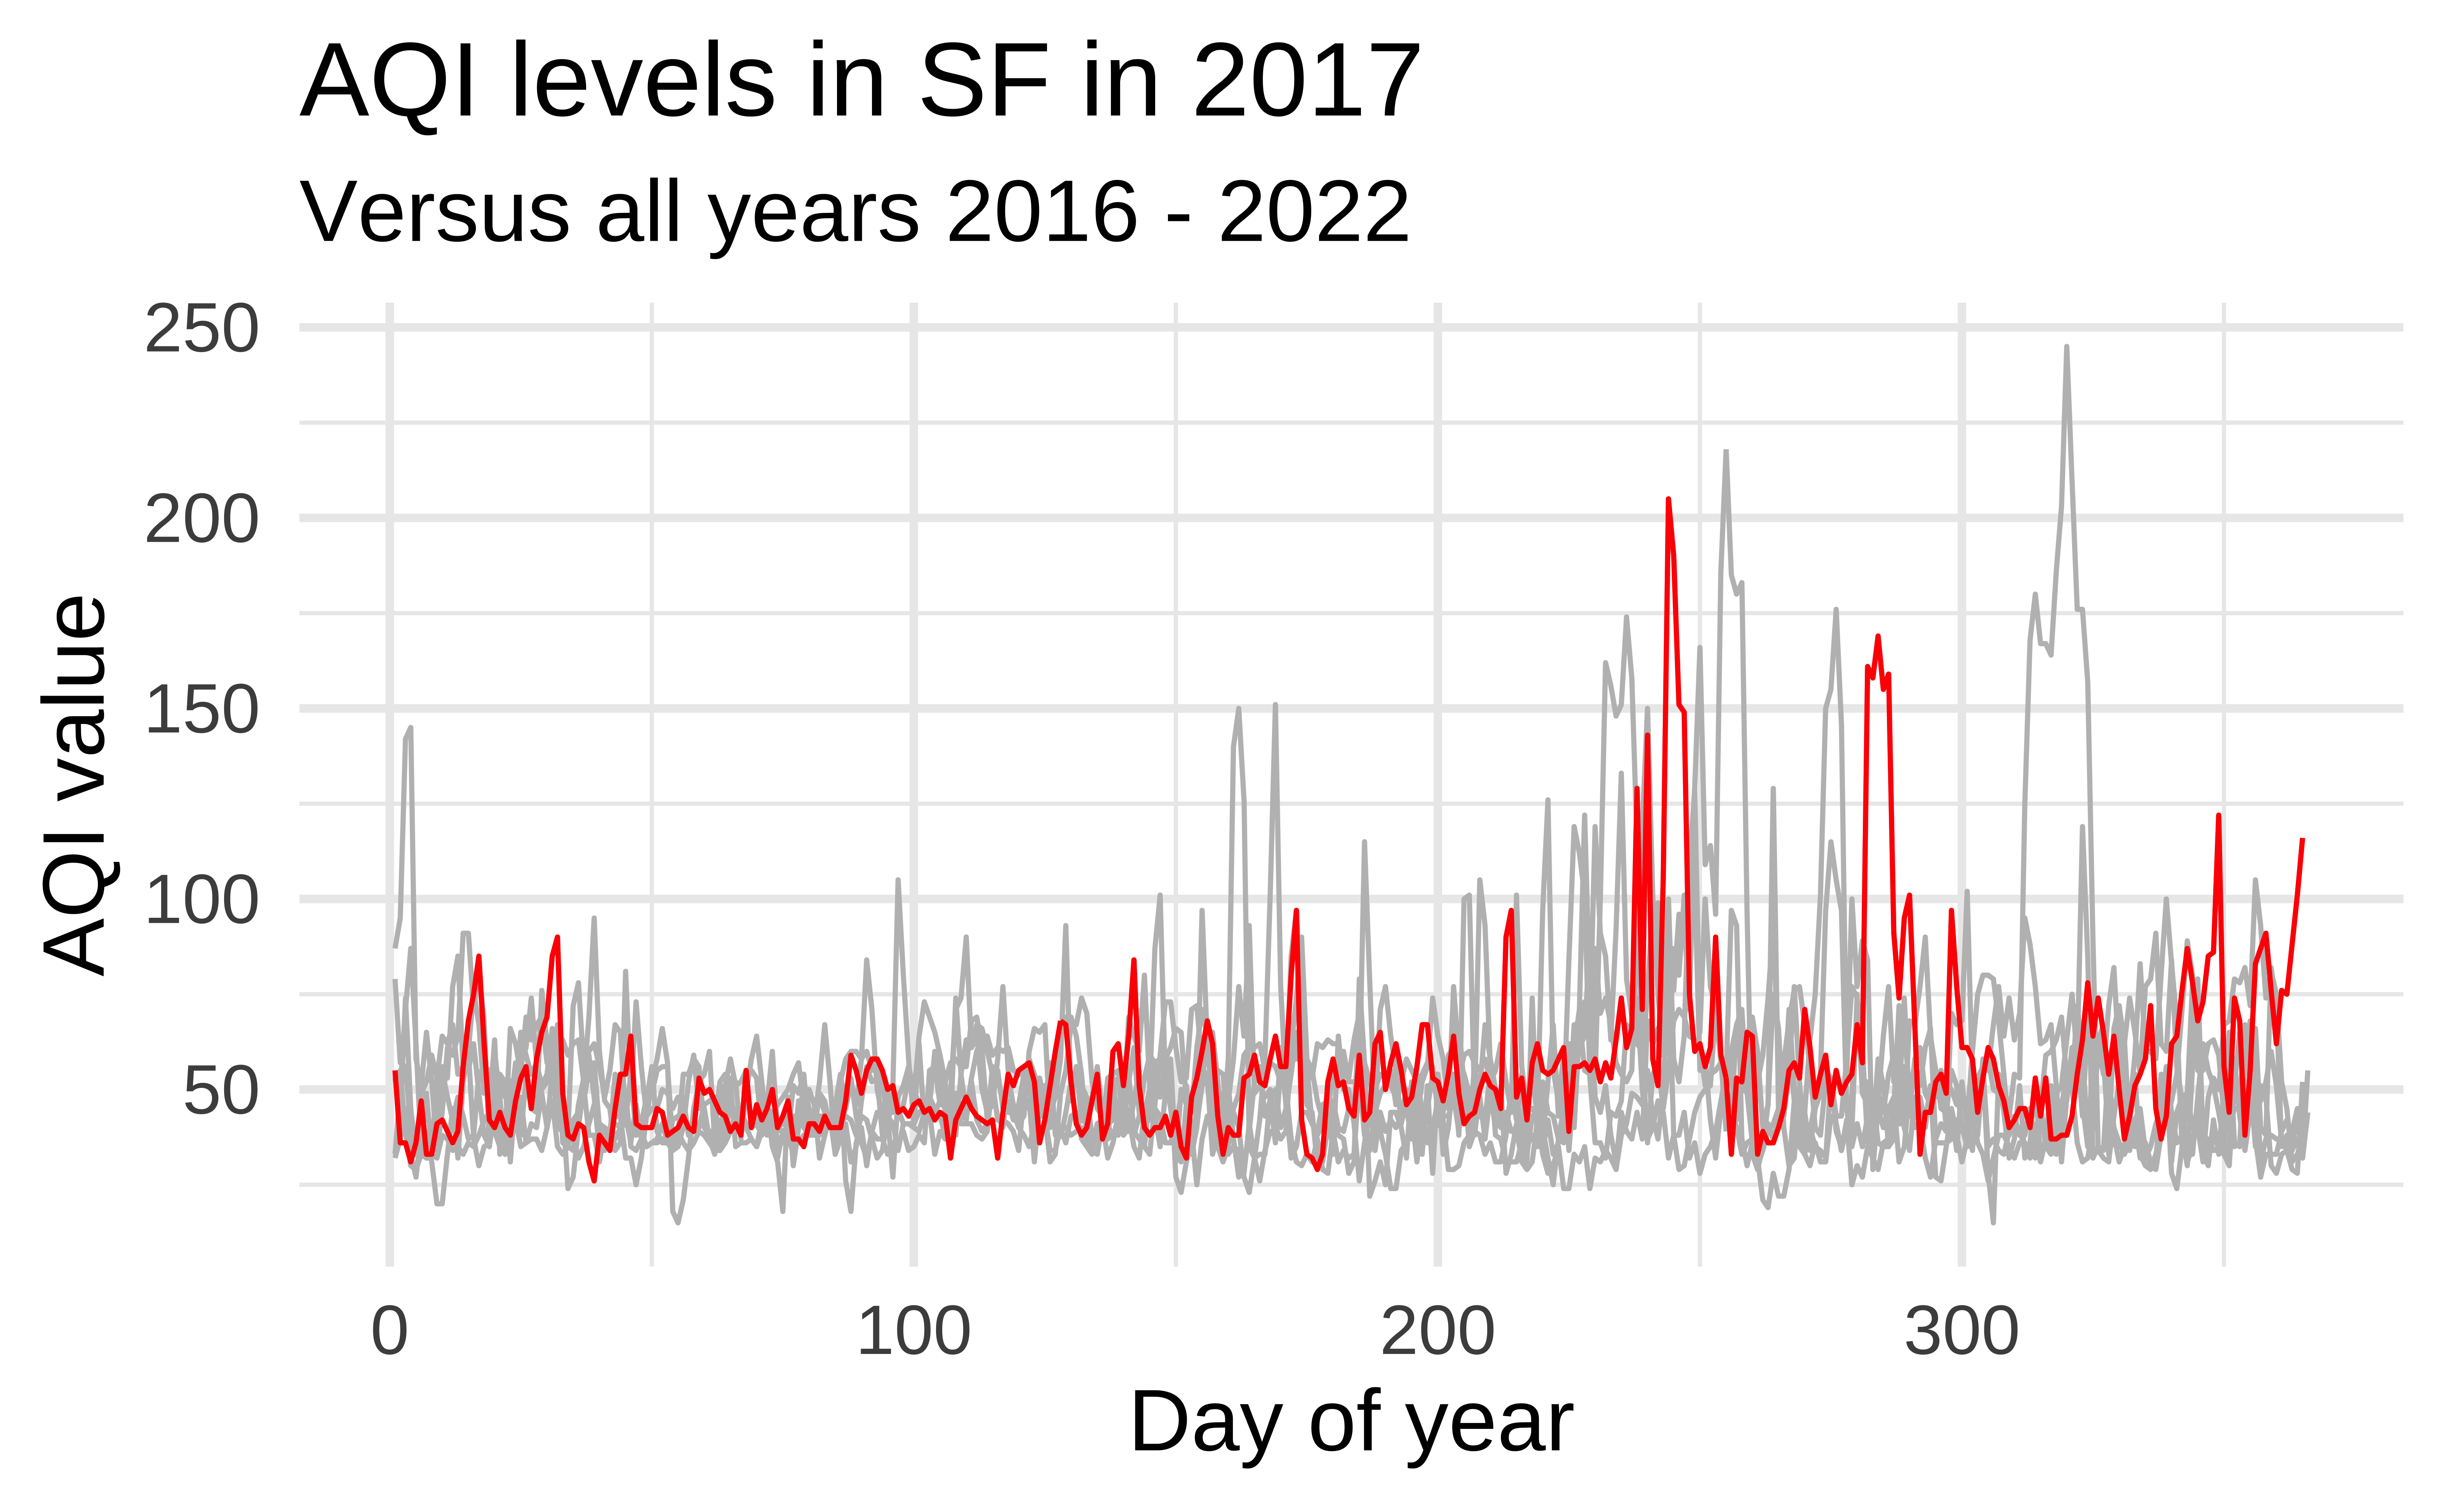
Highlight 2017
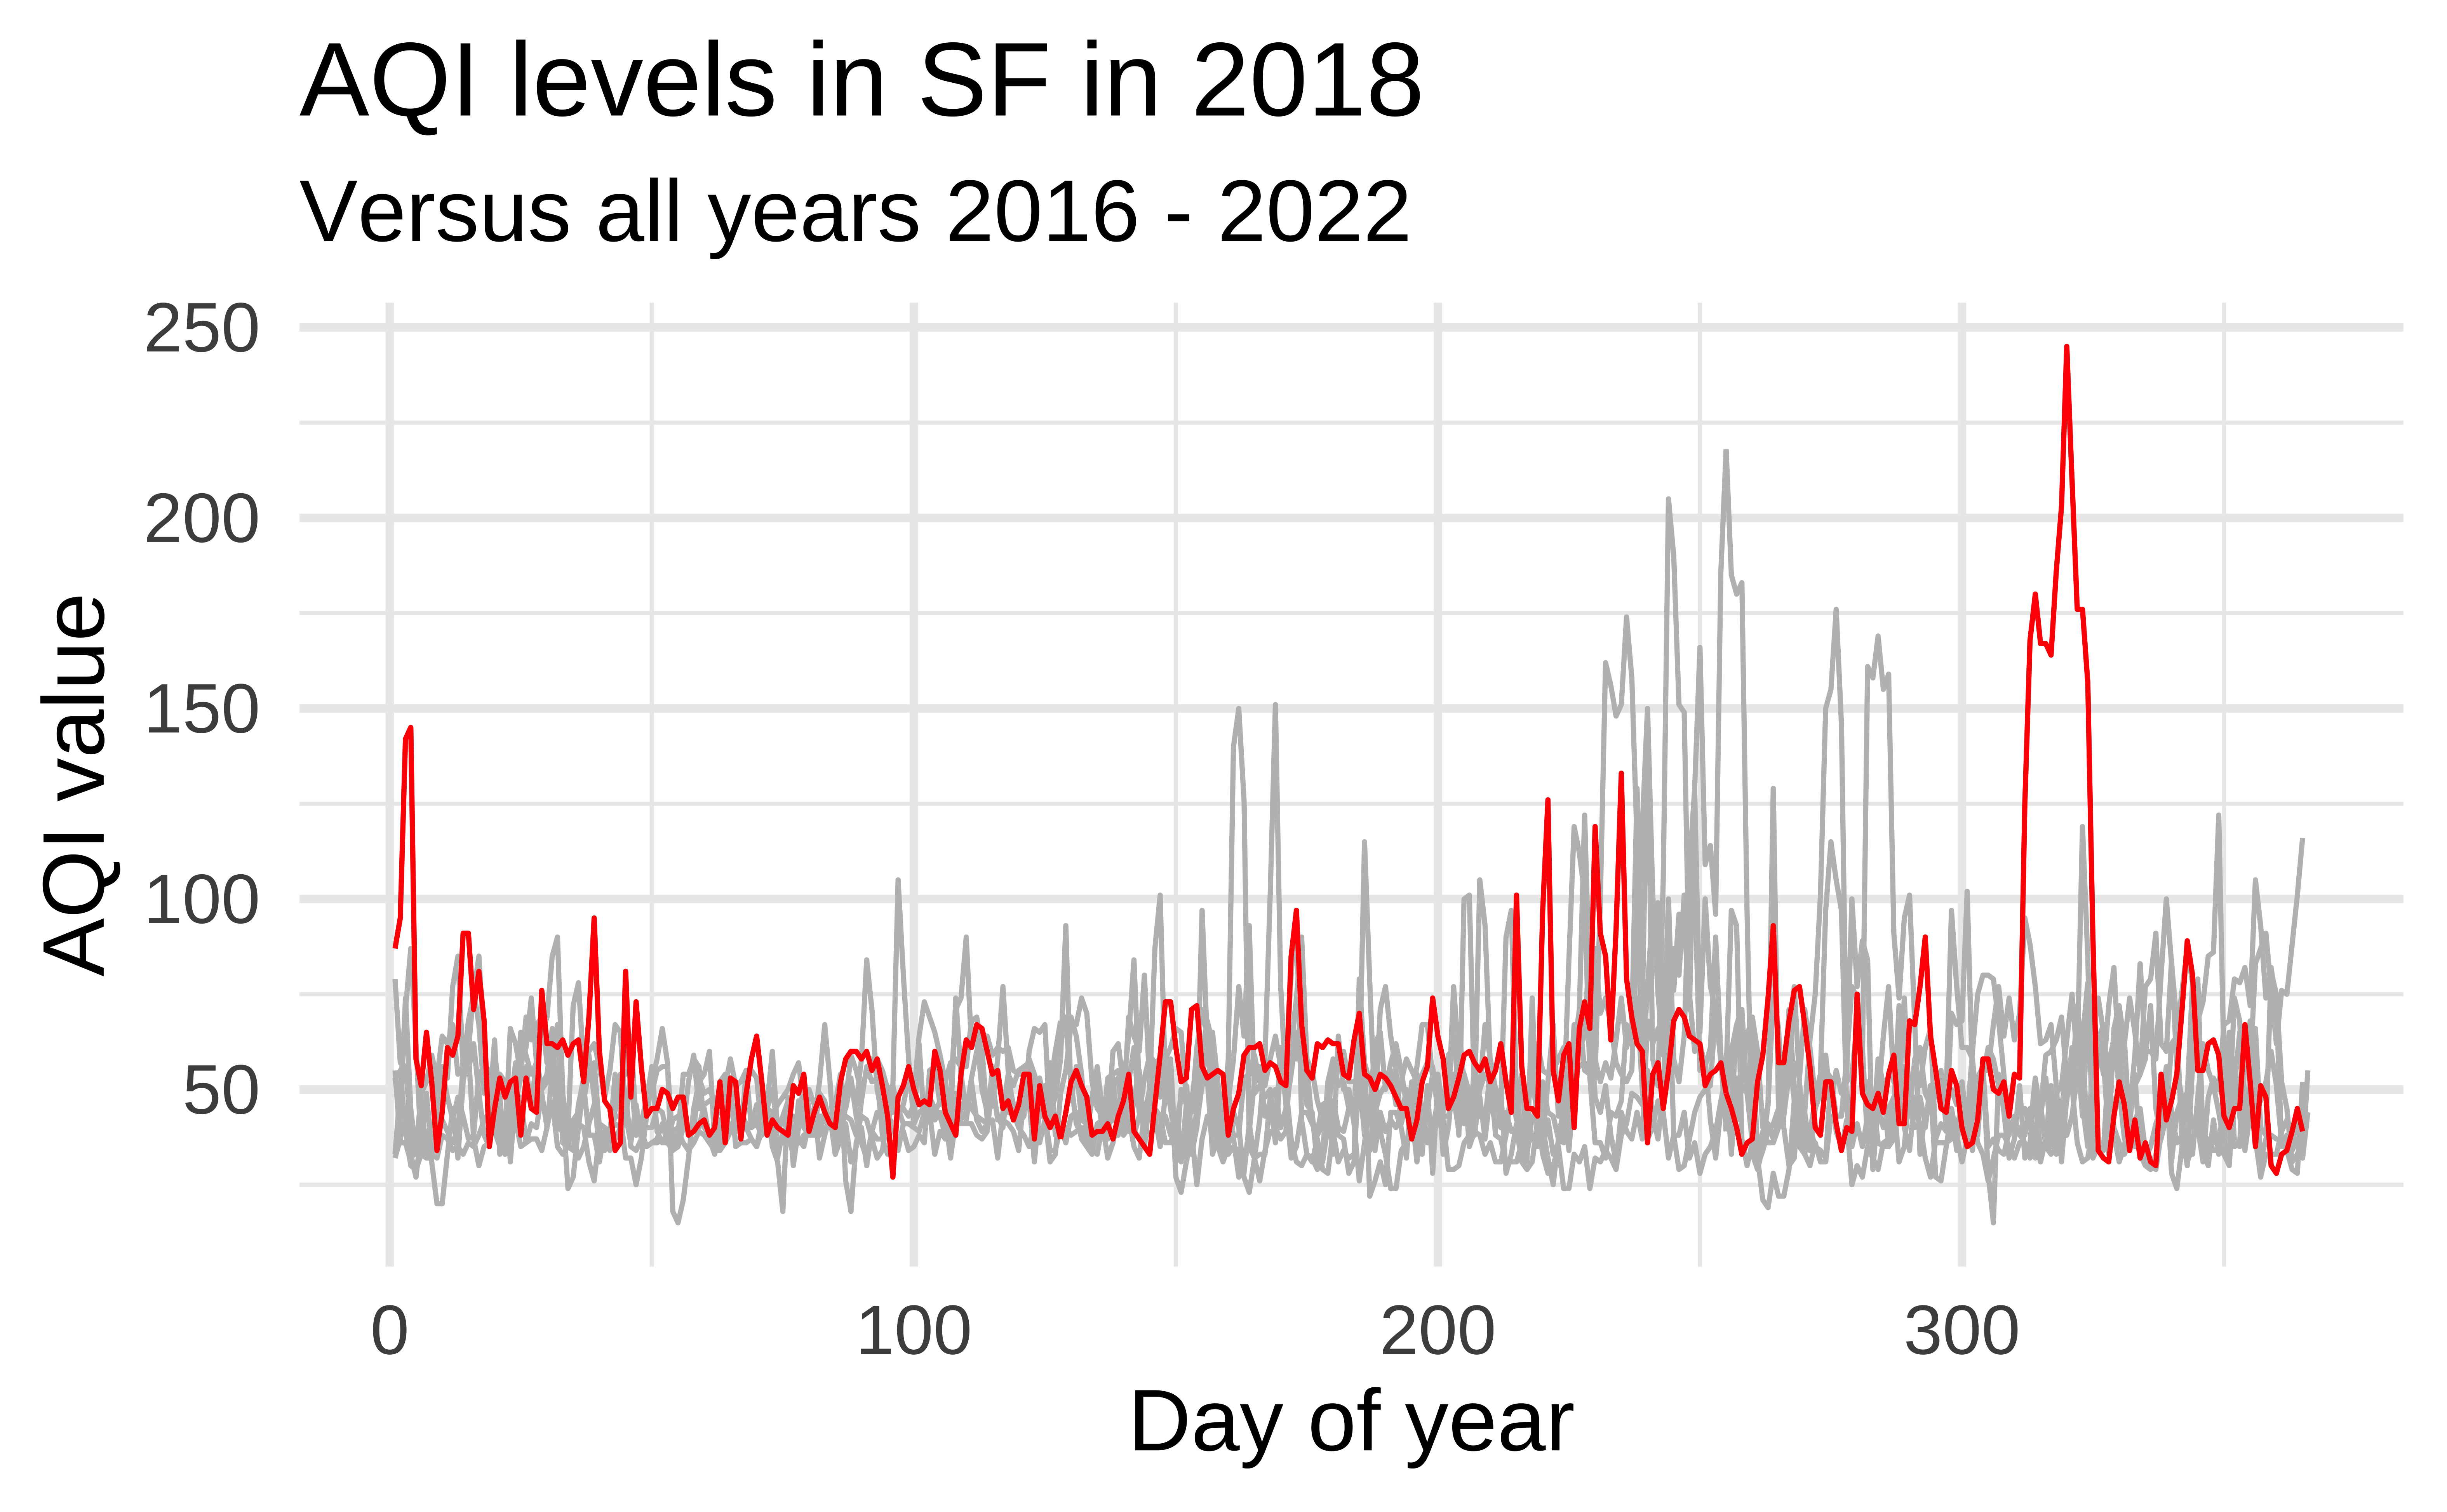
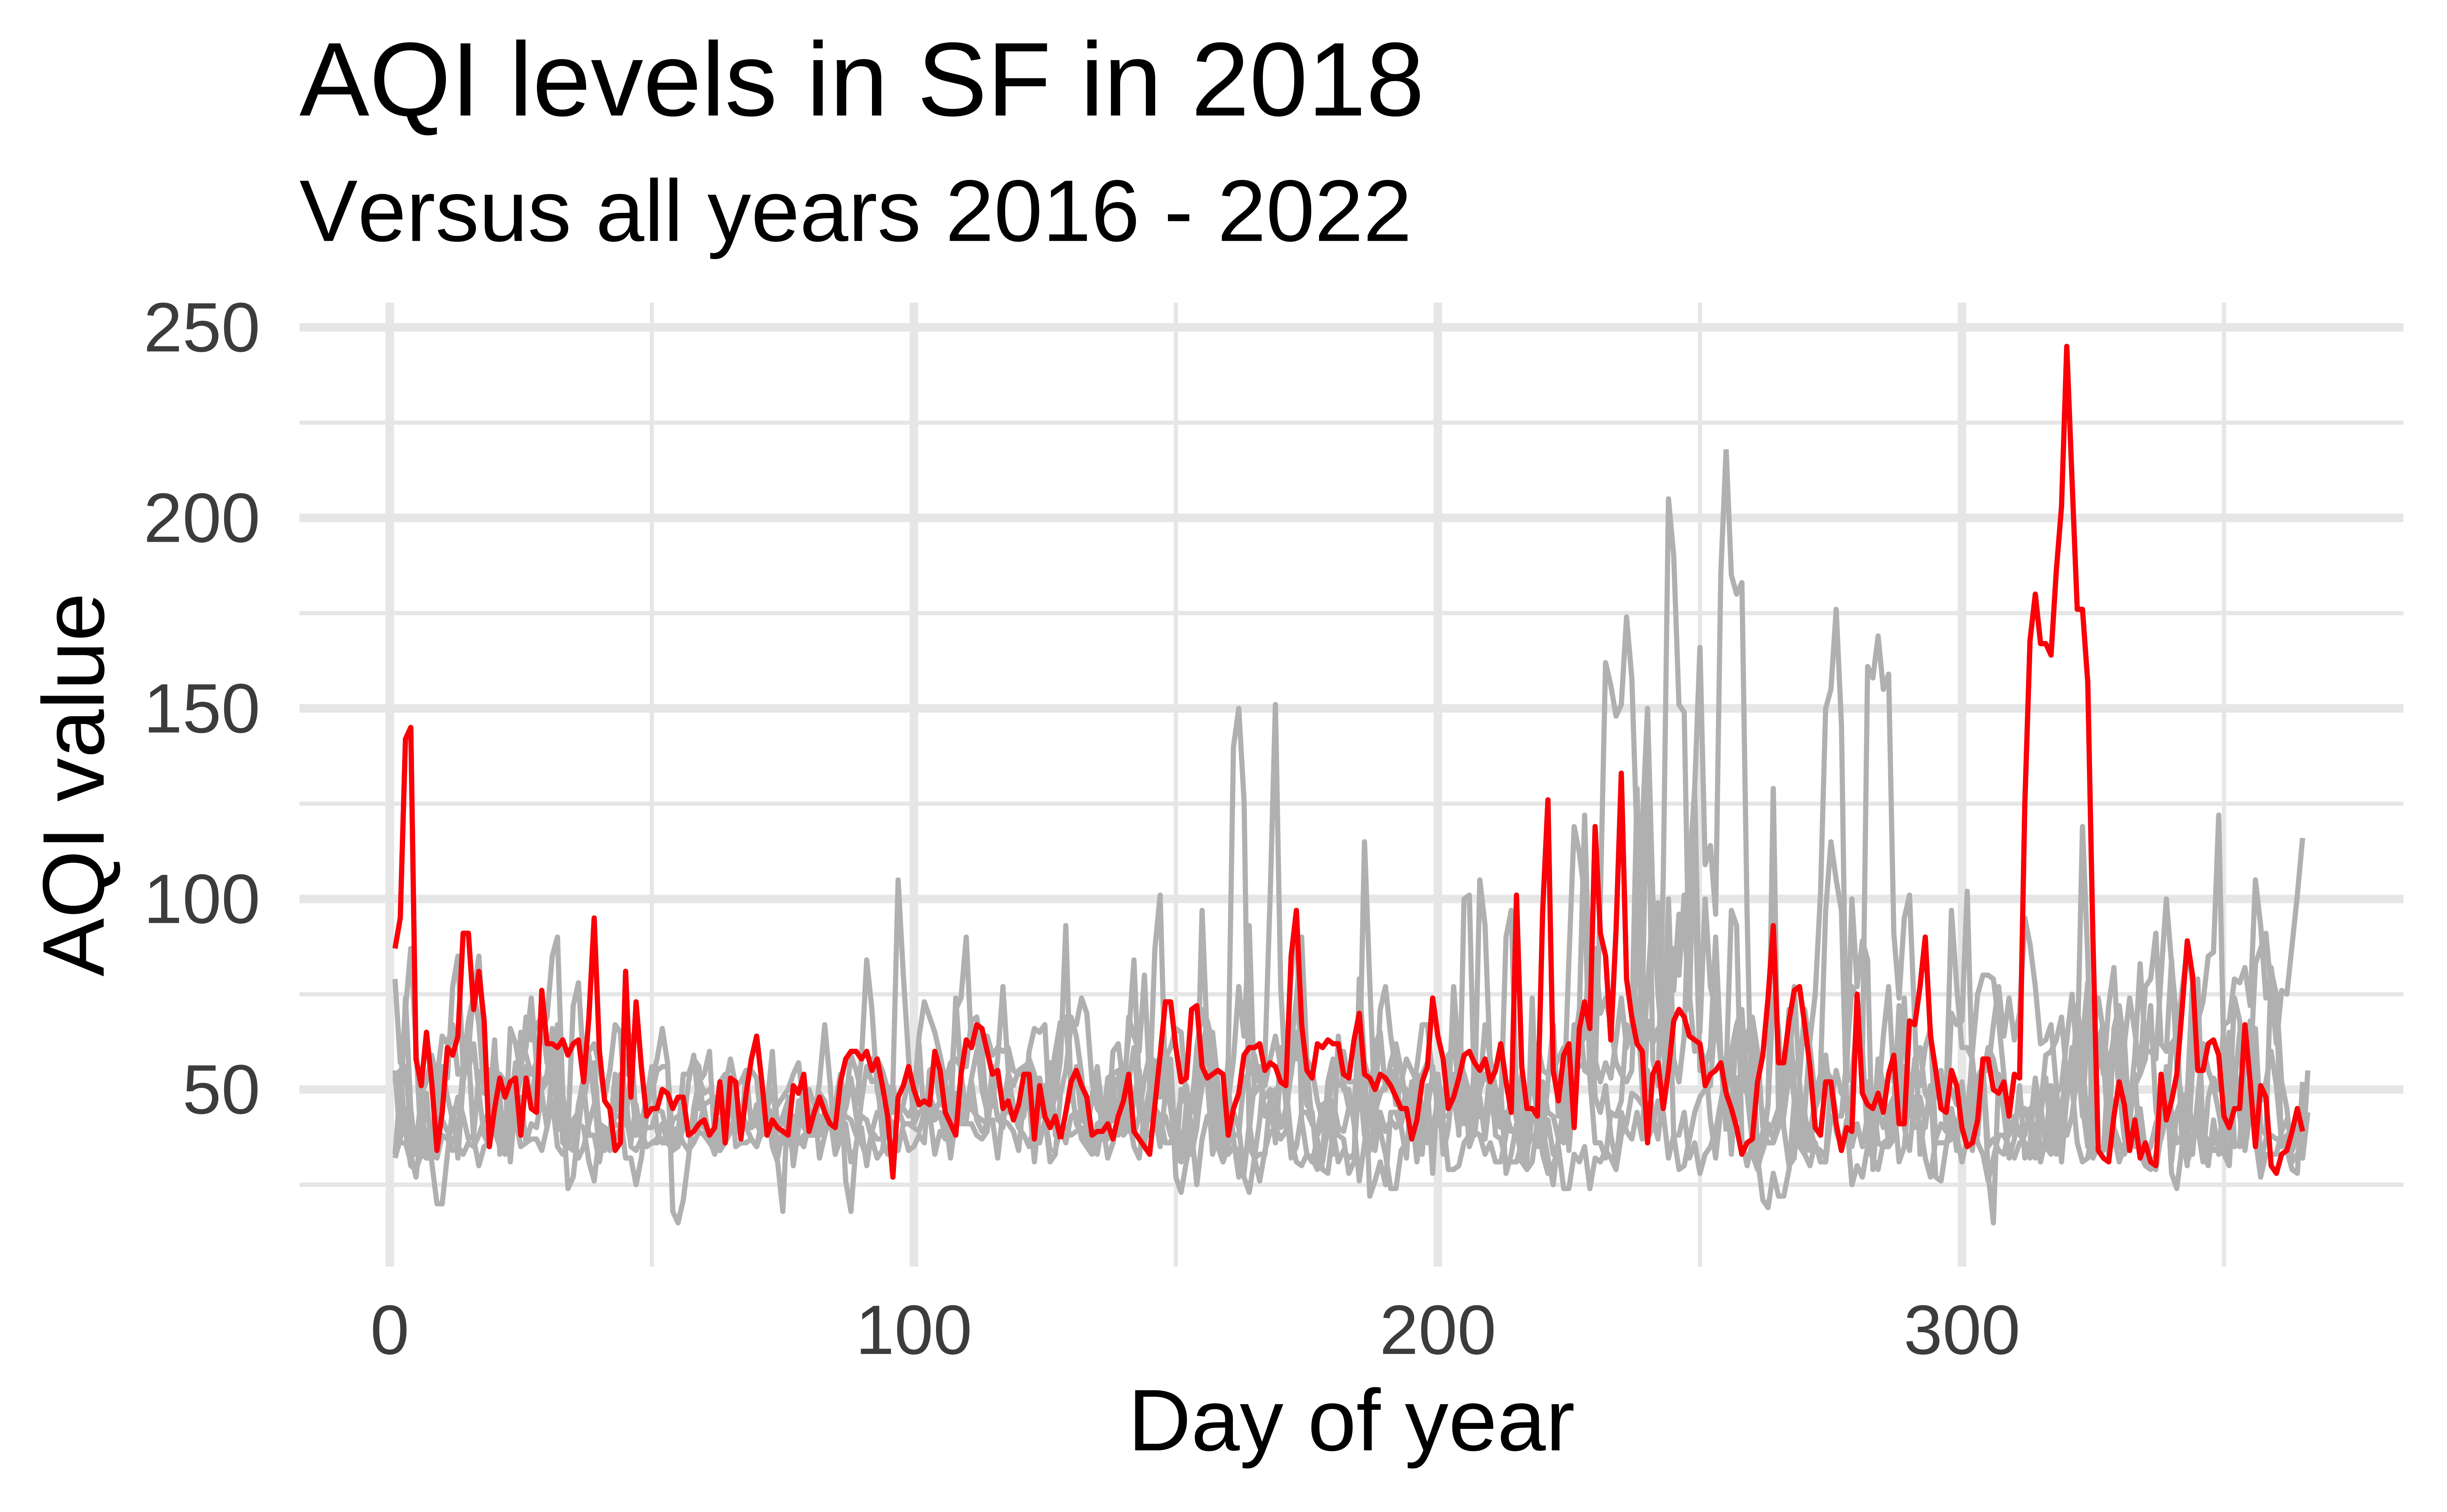
Highlight 2018
Highlight any year
year_to_highlight <- 2018

ggplot(sf, aes(x = day_of_year, y = aqi_value, group = year)) +
  geom_line(color = "gray") +
  geom_line(data = sf |> filter(year == year_to_highlight), color = "red") +
  labs(
    title = glue("AQI levels in SF in {year_to_highlight}"),
    subtitle = "Versus all years 2016 - 2022",
    x = "Day of year", y = "AQI value"
  )
Highlight with gghighlight
Highlight years where maximum observed AQI value exceeds 200 using gghighlight.
![]()