Data wrangling + tidying - II

Lecture 4

Dr. Mine Çetinkaya-Rundel

Duke University
STA 313 - Spring 2024

Warm up

Check-in

Any high-level questions on HW 1?

.

Setup

# load packages
library(tidyverse)
library(countdown)
library(scales)
library(ggthemes)
library(glue)
library(gt)         # For "great" tables
library(MoMAColors) # For color palettes inspired by artworks at MomA

# set theme for ggplot2
ggplot2::theme_set(ggplot2::theme_minimal(base_size = 14))

# set width of code output
options(width = 65)

# set figure parameters for knitr
knitr::opts_chunk$set(
  fig.width = 7, # 7" width
  fig.asp = 0.618, # the golden ratio
  fig.retina = 3, # dpi multiplier for displaying HTML output on retina
  fig.align = "center", # center align figures
  dpi = 300 # higher dpi, sharper image
)

Transforming and reshaping a single data frame (cont.)

From last time: Monthly bookings

Any questions about recreating any aspect of this plot?

From last time: Monthly bookings

Reveal below for code for creating the previous plot.

Code
hotels <- read_csv("https://raw.githubusercontent.com/rfordatascience/tidytuesday/master/data/2020/2020-02-11/hotels.csv")

hotels <- hotels |>
  mutate(
    arrival_date_month = fct_relevel(arrival_date_month, month.name),
    season = case_when(
      arrival_date_month %in% c("December", "January", "February") ~ "Winter",
      arrival_date_month %in% c("March", "April", "May") ~ "Spring",
      arrival_date_month %in% c("June", "July", "August") ~ "Summer",
      TRUE ~ "Fall"
    ),
    season = fct_relevel(season, "Winter", "Spring", "Summer", "Fall")
  )

hotels |>
  count(season, hotel, arrival_date_month) |>
  ggplot(aes(x = arrival_date_month, y = n, group = hotel, linetype = hotel)) +
  geom_line(linewidth = 0.8, color = "cornsilk4") +
  geom_point(aes(shape = season, color = season), size = 4, show.legend = FALSE) +
  scale_x_discrete(labels = month.abb) +
  scale_color_colorblind() +
  scale_shape_manual(values = c("circle", "square", "diamond", "triangle")) +
  labs(
    x = "Arrival month", y = "Number of bookings", linetype = NULL,
    title = "Number of monthly bookings",
    subtitle = "July 2015 to August 2017",
    caption = "Source: Antonio, Almeida and Nunes (2019) | TidyTuesday"
  ) +
  coord_cartesian(clip = "off") +
  theme(
    legend.position = c(0.12, 0.9),
    legend.box.background = element_rect(fill = "white", color = "white"),
    plot.subtitle = element_text(color = "cornsilk4"),
    plot.caption = element_text(color = "cornsilk4")
  )

A few takeaways

  • forcats::fct_relevel() in a mutate() is useful for custom ordering of levels of a factor variable

  • summarize() after group_by() with multiple variables results in a message about the grouping structure of the resulting data frame – the message can be suppressed by defining .groups (e.g., .groups = "drop" or .groups = "keep")

  • summarize() also lets you get away with being sloppy and not naming your new column, but that’s not recommended!

Rowwise operations

We want to calculate the total number of guests for each booking. Why does the following not work?

hotels |>
  select(adults, children, babies) |>
  mutate(guests = sum(c(adults, children, babies)))
# A tibble: 119,390 × 4
   adults children babies guests
    <dbl>    <dbl>  <dbl>  <dbl>
 1      2        0      0     NA
 2      2        0      0     NA
 3      1        0      0     NA
 4      1        0      0     NA
 5      2        0      0     NA
 6      2        0      0     NA
 7      2        0      0     NA
 8      2        0      0     NA
 9      2        0      0     NA
10      2        0      0     NA
# ℹ 119,380 more rows

Rowwise operations

hotels |>
  select(adults, children, babies) |>
  rowwise() |>
  mutate(guests = sum(c(adults, children, babies))) |>
  filter(adults > 0, children > 0, babies > 0) # to show sum works
# A tibble: 172 × 4
# Rowwise: 
   adults children babies guests
    <dbl>    <dbl>  <dbl>  <dbl>
 1      2        1      1      4
 2      2        1      1      4
 3      2        1      1      4
 4      2        1      1      4
 5      2        1      1      4
 6      2        1      1      4
 7      2        1      1      4
 8      2        2      1      5
 9      2        2      1      5
10      1        2      1      4
# ℹ 162 more rows

Columnwise operations

Use across() combined with summarise() to calculate summary statistics for multiple columns at once:

hotels |>
  summarise(across(.cols = starts_with("stays"), mean))
# A tibble: 1 × 2
  stays_in_weekend_nights stays_in_week_nights
                    <dbl>                <dbl>
1                   0.928                 2.50
hotels |>
  summarise(across(.cols = starts_with("stays"), list(mean, sd))) |>
  glimpse()
Rows: 1
Columns: 4
$ stays_in_weekend_nights_1 <dbl> 0.9275986
$ stays_in_weekend_nights_2 <dbl> 0.9986135
$ stays_in_week_nights_1    <dbl> 2.500302
$ stays_in_week_nights_2    <dbl> 1.908286

Select helpers

  • starts_with(): Starts with a prefix
  • ends_with(): Ends with a suffix
  • contains(): Contains a literal string
  • num_range(): Matches a numerical range like x01, x02, x03
  • one_of(): Matches variable names in a character vector
  • everything(): Matches all variables
  • last_col(): Select last variable, possibly with an offset
  • matches(): Matches a regular expression (a sequence of symbols/characters expressing a string/pattern to be searched for within text)

Columnwise operations

hotels |>
  group_by(hotel, is_canceled) |>
  summarise(
    across(.cols = starts_with("stays"), list(mean = mean, sd = sd), .names = "{.fn}_{.col}")
  ) |>
  glimpse()
Rows: 4
Columns: 6
Groups: hotel [2]
$ hotel                        <chr> "City Hotel", "City Hotel", "Resort Hotel", "Resort Hotel"
$ is_canceled                  <dbl> 0, 1, 0, 1
$ mean_stays_in_weekend_nights <dbl> 0.8006836, 0.7875053, 1.1339070, 1.3352814
$ sd_stays_in_weekend_nights   <dbl> 0.8615080, 0.9168195, 1.1442298, 1.1444040
$ mean_stays_in_week_nights    <dbl> 2.122934, 2.266781, 3.008985, 3.440299
$ sd_stays_in_week_nights      <dbl> 1.400799, 1.526787, 2.450714, 2.461699

Columnwise operations

hotels |>
  group_by(hotel, is_canceled) |>
  summarise(
    across(.cols = starts_with("stays"), list(mean = mean, sd = sd), .names = "{.fn}_{.col}"),
    .groups = "drop"
  )
# A tibble: 4 × 6
  hotel        is_canceled mean_stays_in_weekend_nig…¹ sd_stays_in_weekend_…² mean_stays_in_week_n…³
  <chr>              <dbl>                       <dbl>                  <dbl>                  <dbl>
1 City Hotel             0                       0.801                  0.862                   2.12
2 City Hotel             1                       0.788                  0.917                   2.27
3 Resort Hotel           0                       1.13                   1.14                    3.01
4 Resort Hotel           1                       1.34                   1.14                    3.44
# ℹ abbreviated names: ¹​mean_stays_in_weekend_nights, ²​sd_stays_in_weekend_nights,
#   ³​mean_stays_in_week_nights
# ℹ 1 more variable: sd_stays_in_week_nights <dbl>

Setup for next example: hotel_summary

hotels_summary <- hotels |>
  group_by(hotel, is_canceled) |>
  summarise(
    across(
      .cols = starts_with("stays"),
      list(mean = mean),
      .names = "{.fn}_{.col}"
    ),
    .groups = "drop"
  )

hotels_summary
# A tibble: 4 × 4
  hotel        is_canceled mean_stays_in_weekend_nights mean_stays_in_week_nights
  <chr>              <dbl>                        <dbl>                     <dbl>
1 City Hotel             0                        0.801                      2.12
2 City Hotel             1                        0.788                      2.27
3 Resort Hotel           0                        1.13                       3.01
4 Resort Hotel           1                        1.34                       3.44

Mean number of stays

Which variables are plotted in the following visualization? Which aesthetics are they mapped to?

Mean number of stays

ae-03 - Part 3: Let’s recreate this visualization!

Livecoding

Reveal below for code developed during live coding session.

Code
hotels_summary |>
  mutate(is_canceled = if_else(is_canceled == 0, "Not canceled", "Canceled")) |>
  pivot_longer(
    cols = starts_with("mean"),
    names_to = "day_type",
    values_to = "mean_stays",
    names_prefix = "mean_stays_in_"
  ) |>
  mutate(
    day_type = if_else(str_detect(day_type, "weekend"), "Weekend", "Weekday")
  ) |>
  ggplot(aes(
    x = str_wrap(is_canceled, 10), y = mean_stays,
    group = hotel, color = hotel
  )) +
  geom_point(show.legend = FALSE) +
  geom_line(aes(linetype = hotel), linewidth = 1) +
  facet_wrap(~day_type) +
  labs(
    x = "Booking status",
    y = "Mean number of\nnights of stay",
    color = NULL, linetype = NULL,
    title = "Mean number of stays",
    subtitle = "By hotel type and booking status",
    caption = "Source: Antonio, Almeida and Nunes (2019) | TidyTuesday"
  ) +
  scale_color_manual(values = c("cornsilk4", "deepskyblue3")) +
  scale_y_continuous(limits = c(0, 4), breaks = 0:4) +
  theme(legend.position = "bottom")

tidyr 101

  • pivot_wider() and pivot_longer()
  • Incredibly useful for reshaping for plotting
  • Lots of extra arguments to help with reshaping pain!
  • Refer to pivoting vignette when needed

Animation showing what pivoting longer and wider look like

Stats

Stats < > geoms

  • Statistical transformation (stat) transforms the data, typically by summarizing
  • Many of ggplot2’s stats are used behind the scenes to generate many important geoms
stat geom
stat_bin() geom_bar(), geom_freqpoly(), geom_histogram()
stat_bin2d() geom_bin2d()
stat_bindot() geom_dotplot()
stat_binhex() geom_hex()
stat_boxplot() geom_boxplot()
stat_contour() geom_contour()
stat_quantile() geom_quantile()
stat_smooth() geom_smooth()
stat_sum() geom_count()

Layering with stats

hotels |>
  filter(adr < 4000) |>
  ggplot(aes(x = arrival_date_month, y = adr)) +
  geom_point(alpha = 0.5) +
  stat_summary(
    geom = "point", fun = "median",
    colour = "red", size = 5, pch = 4, stroke = 2
  ) +
  facet_wrap(~hotel, ncol = 1)

Alternate: layering with stats

hotels |>
  filter(adr < 4000) |>
  ggplot(aes(x = arrival_date_month, y = adr)) +
  geom_point(alpha = 0.5) +
  geom_point(
    stat = "summary", fun = "median",
    colour = "red", size = 5, pch = 4, stroke = 2
  ) +
  facet_wrap(~hotel, ncol = 1)

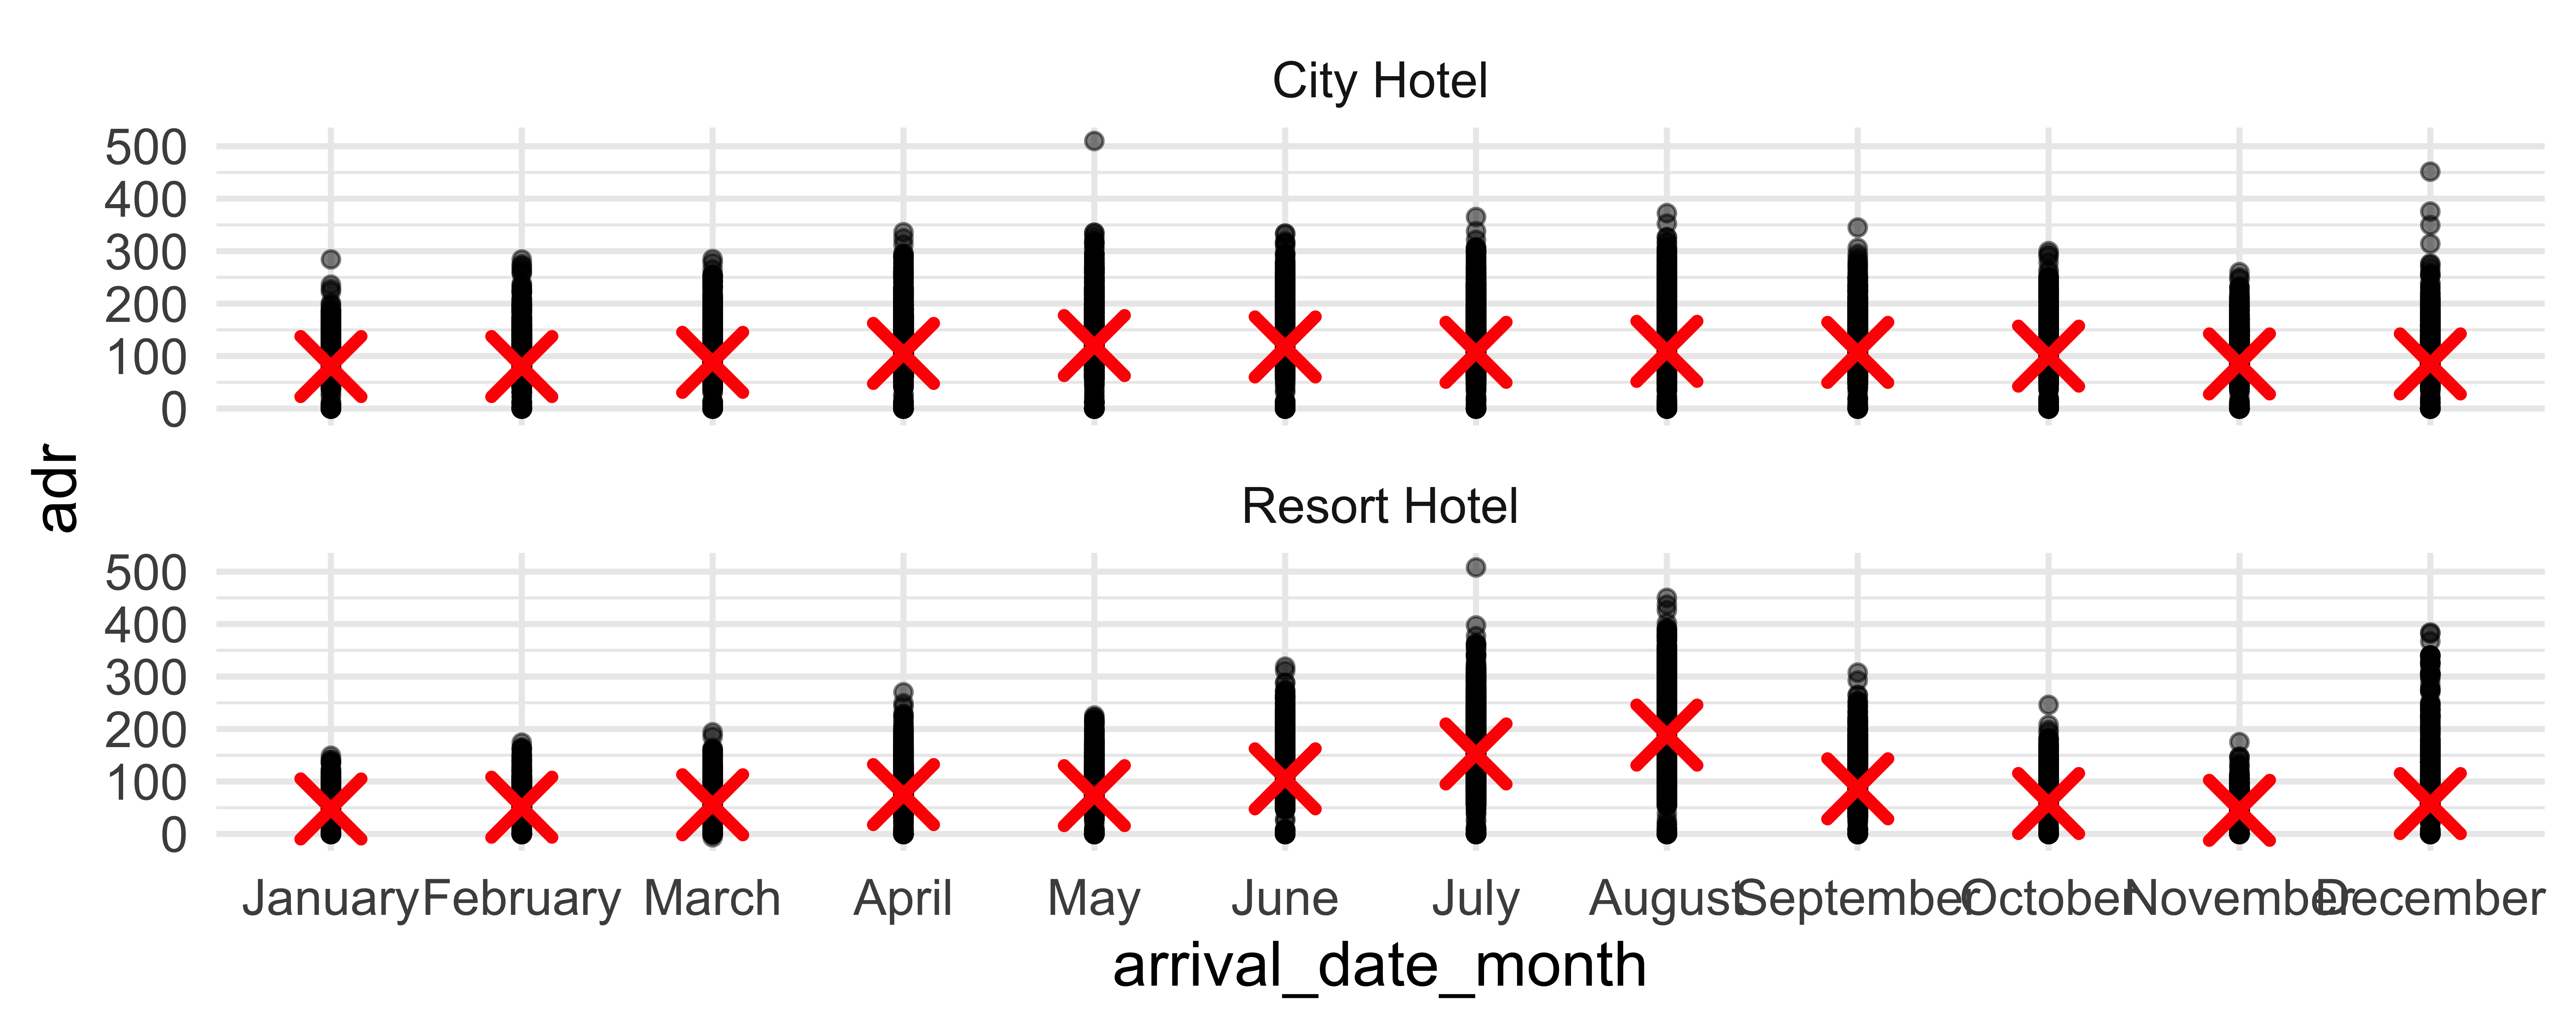
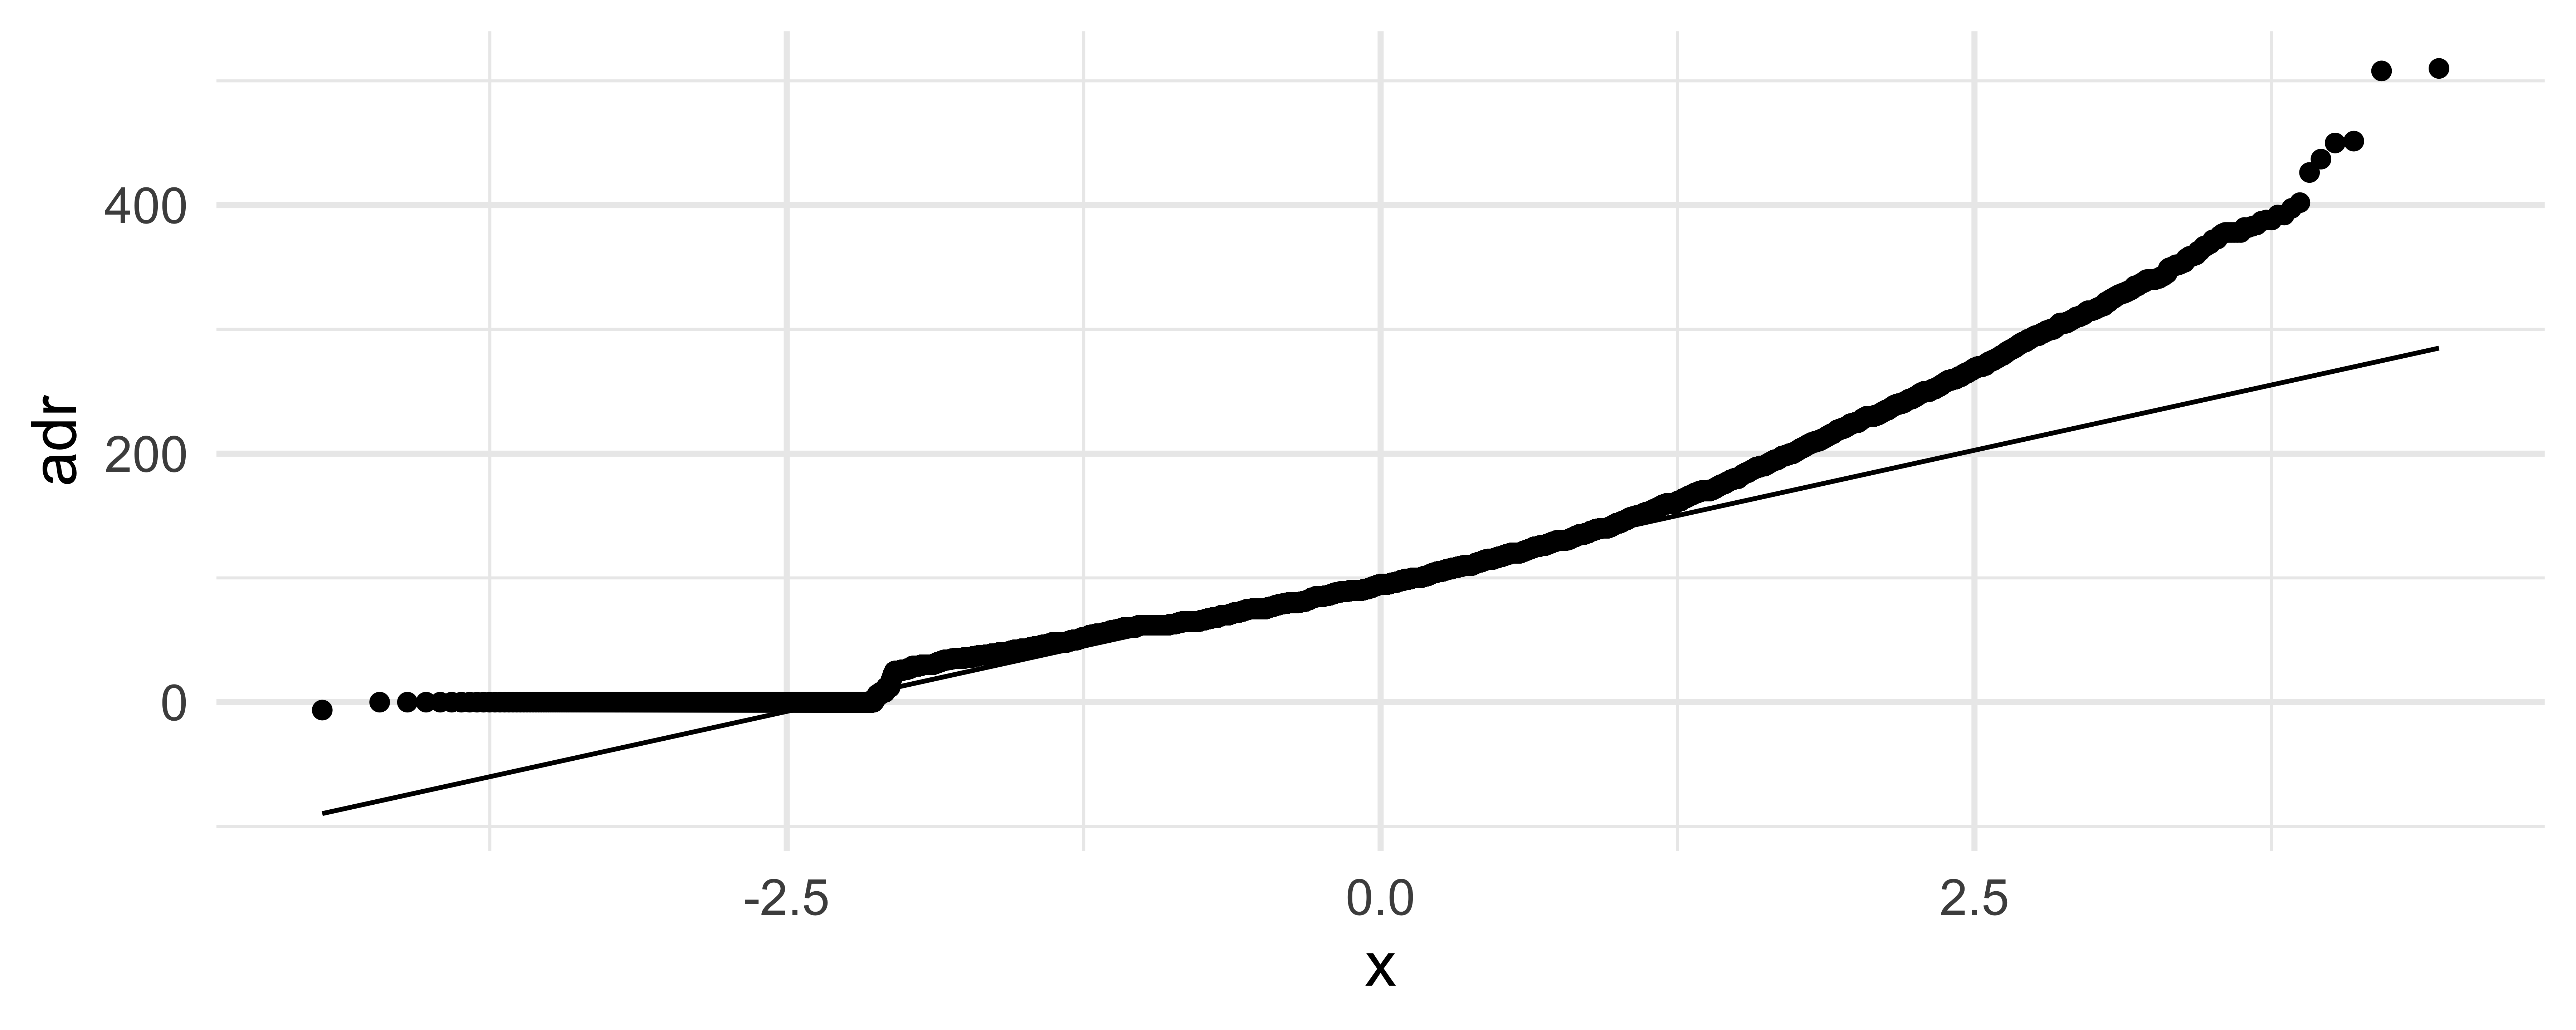
Statistical transformations

What can you say about the distribution of price from the following QQ plot?

hotels |>
  filter(adr < 4000) |>
  ggplot(aes(sample = adr)) +
  stat_qq() +
  stat_qq_line() +
  labs(y = "adr")

Bringing together multiple data frames

Scenario 2

We…

have multiple data frames

want to want to bring them together so we can plot them

professions <- read_csv("data/professions.csv")
dates <- read_csv("data/dates.csv")
works <- read_csv("data/works.csv")

10 women in science who changed the world

name
Ada Lovelace
Marie Curie
Janaki Ammal
Chien-Shiung Wu
Katherine Johnson
Rosalind Franklin
Vera Rubin
Gladys West
Flossie Wong-Staal
Jennifer Doudna

Inputs

professions
# A tibble: 10 × 2
   name               profession                        
   <chr>              <chr>                             
 1 Ada Lovelace       Mathematician                     
 2 Marie Curie        Physicist and Chemist             
 3 Janaki Ammal       Botanist                          
 4 Chien-Shiung Wu    Physicist                         
 5 Katherine Johnson  Mathematician                     
 6 Rosalind Franklin  Chemist                           
 7 Vera Rubin         Astronomer                        
 8 Gladys West        Mathematician                     
 9 Flossie Wong-Staal Virologist and Molecular Biologist
10 Jennifer Doudna    Biochemist                        
dates
# A tibble: 8 × 3
  name               birth_year death_year
  <chr>                   <dbl>      <dbl>
1 Janaki Ammal             1897       1984
2 Chien-Shiung Wu          1912       1997
3 Katherine Johnson        1918       2020
4 Rosalind Franklin        1920       1958
5 Vera Rubin               1928       2016
6 Gladys West              1930         NA
7 Flossie Wong-Staal       1947         NA
8 Jennifer Doudna          1964         NA
works
# A tibble: 9 × 2
  name               known_for                                                        
  <chr>              <chr>                                                            
1 Ada Lovelace       first computer algorithm                                         
2 Marie Curie        theory of radioactivity,  first woman Nobel Prize win            
3 Janaki Ammal       hybrid species, biodiversity protection                          
4 Chien-Shiung Wu    experiment overturning theory of parity                          
5 Katherine Johnson  orbital mechanics critical to sending first Americans into space 
6 Vera Rubin         existence of dark matter                                         
7 Gladys West        mathematical modeling of the shape of the Earth                  
8 Flossie Wong-Staal first to clone HIV and map its genes, which led to test for virus
9 Jennifer Doudna    one of the primary developers of CRISPR                          

Desired output

# A tibble: 10 × 5
   name               profession                         birth_year death_year known_for            
   <chr>              <chr>                                   <dbl>      <dbl> <chr>                
 1 Ada Lovelace       Mathematician                              NA         NA first computer algor…
 2 Marie Curie        Physicist and Chemist                      NA         NA theory of radioactiv…
 3 Janaki Ammal       Botanist                                 1897       1984 hybrid species, biod…
 4 Chien-Shiung Wu    Physicist                                1912       1997 experiment overturni…
 5 Katherine Johnson  Mathematician                            1918       2020 orbital mechanics cr…
 6 Rosalind Franklin  Chemist                                  1920       1958 <NA>                 
 7 Vera Rubin         Astronomer                               1928       2016 existence of dark ma…
 8 Gladys West        Mathematician                            1930         NA mathematical modelin…
 9 Flossie Wong-Staal Virologist and Molecular Biologist       1947         NA first to clone HIV a…
10 Jennifer Doudna    Biochemist                               1964         NA one of the primary d…

Inputs, reminder

names(professions)
[1] "name"       "profession"
names(dates)
[1] "name"       "birth_year" "death_year"
names(works)
[1] "name"      "known_for"
nrow(professions)
[1] 10
nrow(dates)
[1] 8
nrow(works)
[1] 9

Joining data frames

Which, if any, *_join() function is unfamiliar?

something_join(x, y)
  • left_join(): all rows from x
  • right_join(): all rows from y
  • full_join(): all rows from both x and y
  • inner_join(): all rows from x where there are matching values in y, return all combination of multiple matches in the case of multiple matches
  • semi_join(): all rows from x where there are matching values in y, keeping just columns from x
  • anti_join(): return all rows from x where there are not matching values in y, never duplicate rows of x

Setup

For the next few slides…

x <- tibble(
  id = c(1, 2, 3),
  value_x = c("x1", "x2", "x3")
  )

x
# A tibble: 3 × 2
     id value_x
  <dbl> <chr>  
1     1 x1     
2     2 x2     
3     3 x3     
y <- tibble(
  id = c(1, 2, 4),
  value_y = c("y1", "y2", "y4")
  )

y
# A tibble: 3 × 2
     id value_y
  <dbl> <chr>  
1     1 y1     
2     2 y2     
3     4 y4     

left_join()

left_join(x, y)
# A tibble: 3 × 3
     id value_x value_y
  <dbl> <chr>   <chr>  
1     1 x1      y1     
2     2 x2      y2     
3     3 x3      <NA>   

left_join()

professions |>
  left_join(dates)
# A tibble: 10 × 4
   name               profession                         birth_year death_year
   <chr>              <chr>                                   <dbl>      <dbl>
 1 Ada Lovelace       Mathematician                              NA         NA
 2 Marie Curie        Physicist and Chemist                      NA         NA
 3 Janaki Ammal       Botanist                                 1897       1984
 4 Chien-Shiung Wu    Physicist                                1912       1997
 5 Katherine Johnson  Mathematician                            1918       2020
 6 Rosalind Franklin  Chemist                                  1920       1958
 7 Vera Rubin         Astronomer                               1928       2016
 8 Gladys West        Mathematician                            1930         NA
 9 Flossie Wong-Staal Virologist and Molecular Biologist       1947         NA
10 Jennifer Doudna    Biochemist                               1964         NA

right_join()

right_join(x, y)
# A tibble: 3 × 3
     id value_x value_y
  <dbl> <chr>   <chr>  
1     1 x1      y1     
2     2 x2      y2     
3     4 <NA>    y4     

right_join()

professions |>
  right_join(dates)
# A tibble: 8 × 4
  name               profession                         birth_year death_year
  <chr>              <chr>                                   <dbl>      <dbl>
1 Janaki Ammal       Botanist                                 1897       1984
2 Chien-Shiung Wu    Physicist                                1912       1997
3 Katherine Johnson  Mathematician                            1918       2020
4 Rosalind Franklin  Chemist                                  1920       1958
5 Vera Rubin         Astronomer                               1928       2016
6 Gladys West        Mathematician                            1930         NA
7 Flossie Wong-Staal Virologist and Molecular Biologist       1947         NA
8 Jennifer Doudna    Biochemist                               1964         NA

full_join()

full_join(x, y)
# A tibble: 4 × 3
     id value_x value_y
  <dbl> <chr>   <chr>  
1     1 x1      y1     
2     2 x2      y2     
3     3 x3      <NA>   
4     4 <NA>    y4     

full_join()

dates |>
  full_join(works)
# A tibble: 10 × 4
   name               birth_year death_year known_for                                               
   <chr>                   <dbl>      <dbl> <chr>                                                   
 1 Janaki Ammal             1897       1984 hybrid species, biodiversity protection                 
 2 Chien-Shiung Wu          1912       1997 experiment overturning theory of parity                 
 3 Katherine Johnson        1918       2020 orbital mechanics critical to sending first Americans i…
 4 Rosalind Franklin        1920       1958 <NA>                                                    
 5 Vera Rubin               1928       2016 existence of dark matter                                
 6 Gladys West              1930         NA mathematical modeling of the shape of the Earth         
 7 Flossie Wong-Staal       1947         NA first to clone HIV and map its genes, which led to test…
 8 Jennifer Doudna          1964         NA one of the primary developers of CRISPR                 
 9 Ada Lovelace               NA         NA first computer algorithm                                
10 Marie Curie                NA         NA theory of radioactivity,  first woman Nobel Prize win   

inner_join()

inner_join(x, y)
# A tibble: 2 × 3
     id value_x value_y
  <dbl> <chr>   <chr>  
1     1 x1      y1     
2     2 x2      y2     

inner_join()

dates |>
  inner_join(works)
# A tibble: 7 × 4
  name               birth_year death_year known_for                                                
  <chr>                   <dbl>      <dbl> <chr>                                                    
1 Janaki Ammal             1897       1984 hybrid species, biodiversity protection                  
2 Chien-Shiung Wu          1912       1997 experiment overturning theory of parity                  
3 Katherine Johnson        1918       2020 orbital mechanics critical to sending first Americans in…
4 Vera Rubin               1928       2016 existence of dark matter                                 
5 Gladys West              1930         NA mathematical modeling of the shape of the Earth          
6 Flossie Wong-Staal       1947         NA first to clone HIV and map its genes, which led to test …
7 Jennifer Doudna          1964         NA one of the primary developers of CRISPR                  

semi_join()

semi_join(x, y)
# A tibble: 2 × 2
     id value_x
  <dbl> <chr>  
1     1 x1     
2     2 x2     

semi_join()

dates |>
  semi_join(works)
# A tibble: 7 × 3
  name               birth_year death_year
  <chr>                   <dbl>      <dbl>
1 Janaki Ammal             1897       1984
2 Chien-Shiung Wu          1912       1997
3 Katherine Johnson        1918       2020
4 Vera Rubin               1928       2016
5 Gladys West              1930         NA
6 Flossie Wong-Staal       1947         NA
7 Jennifer Doudna          1964         NA

anti_join()

anti_join(x, y)
# A tibble: 1 × 2
     id value_x
  <dbl> <chr>  
1     3 x3     

anti_join()

dates |>
  anti_join(works)
# A tibble: 1 × 3
  name              birth_year death_year
  <chr>                  <dbl>      <dbl>
1 Rosalind Franklin       1920       1958

Putting it altogether

scientists <- professions |>
  left_join(dates) |>
  left_join(works)

scientists
# A tibble: 10 × 5
   name               profession                         birth_year death_year known_for            
   <chr>              <chr>                                   <dbl>      <dbl> <chr>                
 1 Ada Lovelace       Mathematician                              NA         NA first computer algor…
 2 Marie Curie        Physicist and Chemist                      NA         NA theory of radioactiv…
 3 Janaki Ammal       Botanist                                 1897       1984 hybrid species, biod…
 4 Chien-Shiung Wu    Physicist                                1912       1997 experiment overturni…
 5 Katherine Johnson  Mathematician                            1918       2020 orbital mechanics cr…
 6 Rosalind Franklin  Chemist                                  1920       1958 <NA>                 
 7 Vera Rubin         Astronomer                               1928       2016 existence of dark ma…
 8 Gladys West        Mathematician                            1930         NA mathematical modelin…
 9 Flossie Wong-Staal Virologist and Molecular Biologist       1947         NA first to clone HIV a…
10 Jennifer Doudna    Biochemist                               1964         NA one of the primary d…

*_join() functions

  • From dplyr
  • Incredibly useful for bringing datasets with common information (e.g., unique identifier) together
  • Use by argument when the names of the column containing the common information are not the same across datasets
  • Always check that the numbers of rows and columns of the result dataset makes sense
  • Refer to two-table verbs vignette when needed

Visualizing joined data

The following plot displays some information from each of the three data frames:

But first…

What is the plot in the previous slide called?

Livecoding

Reveal below for code developed during live coding session.

Transform
scientists_longer <- scientists |>
  mutate(
    birth_year = case_when(
      name == "Ada Lovelace" ~ 1815,
      name == "Marie Curie" ~ 1867,
      TRUE ~ birth_year
    ),
    death_year = case_when(
      name == "Ada Lovelace" ~ 1852,
      name == "Marie Curie" ~ 1934,
      name == "Flossie Wong-Staal" ~ 2020,
      TRUE ~ death_year
    ),
    status = if_else(is.na(death_year), "alive", "deceased"),
    death_year = if_else(is.na(death_year), 2021, death_year),
    known_for = if_else(name == "Rosalind Franklin", "understanding of the molecular structures of DNA ", known_for)
  ) |>
  pivot_longer(
    cols = contains("year"),
    names_to = "year_type",
    values_to = "year"
  ) |>
  mutate(death_year_fake = if_else(year == 2021, TRUE, FALSE))
Plot
ggplot(scientists_longer, 
       aes(x = year, y = fct_reorder(name, as.numeric(factor(profession))), group = name, color = profession)) +
  geom_point(aes(shape = death_year_fake), show.legend = FALSE) +
  geom_line(aes(linetype = status), show.legend = FALSE) +
  scale_shape_manual(values = c("circle", NA)) +
  scale_linetype_manual(values = c("dashed", "solid")) +
  scale_color_moma_d("Lupi") +
  scale_x_continuous(expand = c(0.01, 0), breaks = seq(1820, 2020, 50)) +
  geom_text(aes(y = name, label = known_for), x = 2030, show.legend = FALSE, hjust = 0) +
  geom_text(aes(label = profession), x = 1809, y = Inf, hjust = 1, vjust = 1, show.legend = FALSE) +
  coord_cartesian(clip = "off") +
  labs(
    x = "Year", y = NULL,
    title = "10 women in science who changed the world",
    caption = "Source: Discover magazine"
  ) +
  facet_grid(profession ~ ., scales = "free_y", space = "free_y", switch = "x") +
  theme(
    plot.margin = unit(c(1, 24, 1, 5), "lines"),
    plot.title.position = "plot",
    plot.caption.position = "plot",
    plot.caption = element_text(hjust = 2), # manual hack
    strip.background = element_blank(),
    strip.text = element_blank(),
    axis.title.x = element_text(hjust = 0),
    panel.background = element_rect(fill = "#f0f0f0", color = "white"),
    panel.grid.major = element_line(color = "white", linewidth = 0.5)
  )